
第二十六篇 Why Statisticians Model Data
本帖最后由 小编D 于 2012-4-26 17:03 编辑
本文由liphking 翻译 spear校稿
Why Statisticians Model Data
How this intrinsic behavior helps build process knowledge
为什么统计学家给数据建模
这个内在行为怎样帮助建立对过程的认知
by Lynne B. Hare
What follows is an apology. Not an apology as in "I’m sorry," but an apology as a justification or explanation.
接下来是一个道歉。不是“对不起”的那种,而是一个理由或者解释。
You might be thinking it shouldn’t be necessary to explain why statisticians model data. It is just their nature. Why do dogs sniff bushes? Why do cats rub up against legs? Why do bears … well, you get the idea.
你可能会觉得没什么必要来解释为什么统计学家会给数据建模。这只是他们的本性,为什么小狗会在灌木丛中嗅来嗅去?为什么小猫会挠腿?为什么熊…好了,你懂的。
The statistician’s behavior may have been learned and then embedded during graduate school and throughout his or her subsequent career—you’ll get no argument from me there. But it is not nearly as mindless or knee-jerk as you might think.
统计学家的这种行为可能是在上大学期间和其后的工作中学到的并得到了强化——这里我不和你争论。但是这不像你可能想象的那样,是无心的或者下意识的。
There are at least two main reasons for data modeling behavior. The more obvious is to learn about variables or factors that influence responses of interest.
给数据建模至少有两个主要的理由。更明显一个,是来了解影响相关响应的变量或因素。
Take as examples the decay of active drug ingredients and the efficacy of certain surfactants in body washes. In the first example, the goal is to learn the effects of time, storage conditions and packaging materials on stability.
比如,有效药物成分的衰减和沐浴露中特定表面活性剂的效果。第一个示例的目的是了解时间、贮存环境和包装材料对稳定性的影响。
In the second, the goal is to determine which surfactants, acting along or in combination and at various proportions of the mix, will be responsible for the greatest efficacy.
第二个示例,目的是用来确定哪些单独或者以各种不同的配比混合使用的表面活性剂会产生最好的效果。
Neither of these goals can be met without modeling data. Both goals are important to the businesses involved, and no one is better positioned to meet them than statisticians.
这两个目的都离不开给数据建模。这两个目标对相关的经营都很重要,而没有人比统计学家更适合干这个的了。
But a second reason for data modeling behavior is as important as the first, and it is applicable to all types of processes. A key element of process improvement is the quantification of process capability. I’m not talking about your father’s Cp or Cpk, but rather about getting down to the inherent, intrinsic variation due to the interface between equipment and raw materials in manufacturing or due to common causes of variation in the service sector.
但是,给数据建模的第二个原因跟第一个同样重要, 并且他适用于各种各样的过程。 过程改进的一个关键要素是量化过程的能力。我跟你说的不是老一辈的那些Cp或者Cpk,而是深入的探究内在的固有的变异,这些变异源于制造过程中设备和原材料的配合或者服务领域的变异的一般原因。
Modeling can help strip away most—if not all—of the assignable causes, leaving a residual variation that represents capability. After capability is estimated, anything that departs from it should be met with intolerance because it gets in the way of performance at its best.
给数据建模可以帮助剥离绝大部分的——如果不是全部——可分配原因(特殊原因),留下一个代表过程能力的残差。过程能力估计出来以后,对任何偏离该值的情况都是不可容忍的,因为这阻止了绩效最大化。
Modeling benefits
建模的好处
Here is an example that does both. It points to potential causal relationships, and it whittles down the total variation to unveil the inherent, intrinsic variation.
下面的示例解释了这两个原因。它指出了潜在的因果关系,也逐渐减少了总变异来揭示出内在的固有的变异。
There is an inline homogenization device—with multiple input and output streams—which mixes ingredients (homogeneously) into hand cream. Some really capable engineers have gotten hold of it as evidenced by its ability to output the amount passed through the streams in millisecond intervals. That’s fast, and it is tempting to turn this monster on and see what it does.
这里是一个在线的均匀化设备——有多个输入和输出流——它把原料搅匀成护手霜。一些能干的工程师找到了它,见证了它以毫秒的间隔输出的能力。那么,接下来打开这个怪兽来看看他到底能干什么是很诱人的。
But a statistical red flag goes up: Do we really need data in millisecond intervals, and wouldn’t they be highly correlated if we had them? That is, wouldn’t high amounts be followed by other high amounts, and wouldn’t lows be followed by lows?
但是一个统计的危险信号出现了:我们真的需要以毫秒为间隔的数据吗?如果我们有了这些,它们不是会高度地相互关联吗?不是一个高的数量紧接着另一个高的数量吗,低的也会紧接着另一个低的?
A local engineer mentioned the reporting interval could be scaled back to one second. As a result, a one-second interval was chosen instead of the default interval, even though the same kind of correlation, called autocorrelation,1 would be expected (although to a lesser extent
一个本地的工程师指出报告的间隔时间可以被按比例调整到1秒。结果是,1秒被用来作为默认间隔。即使同种类型的相互关联称为自相关,也是值得期待的(虽然不是很强烈)。
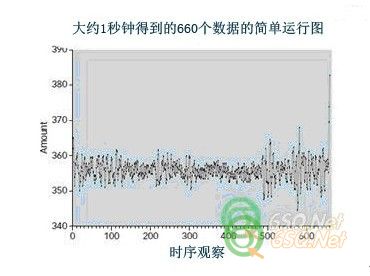
Throwing caution to the wind, we started the homogenizer and let it run until an expert said it had reached equilibrium. I’m not sure what that means, but he had a wrench in his hand, so I didn’t ask. We let it run for a little more than 10 minutes, output the homogenizer’s data into a laptop and plotted the data2 in a simple run chart, as shown in Figure 1.
抛开顾虑,我们开启了这个搅匀器,让它运转直到一个专家说它已经达到平衡。我不知道这是什么意思,但是他手里有个扳手,我也就没再问。我们让它运行了10分钟稍微多一点,把搅匀器的数据输出到电脑上并做成一个简单运行图,如图1所示。
It seems pretty clear that the amounts delivered by the homogenizer are not stable over time. For example, look at the final group of observations beginning at about the 475th observation. Why are they so much more scattered than the earlier observations? We don’t know, of course, but clearly something happened. An increase in variation such as that could not have happened by chance alone.
看起来相当明显,搅匀器的输出量随着时间的推移并不稳定。比如,观察从第475次开始的最后一组观测值,为什么它们比前面的观察数据分散的多?我们不知道,但是很显然出现异常状况了。像这样的变异增加不会只是随机出现的。
If we had failed to plot the data and instead had taken them on blind faith (heaven forbid), we would have calculated a standard deviation of 3.02. Eliminating the observations beyond the 475th brings the standard deviation down to 2.14. That’s a considerable step toward getting to the inherent, intrinsic variation. We could eliminate other segments of the data as well, but the more we do that, the more we risk making arbitrary decisions.
如果我们没能绘出这些数据图表,而是靠着盲目的信心(但愿不会这样),就会计算得到标准差为3.02。删掉475次以后的观察数据,就把标准差降低到2.14。这向得到内在的固有变异迈出了重要的一大步。我们也可以删掉其他的数据段,但是这样做得越多得出武断决定的风险就越高。
Autoregressive model
自回归模型
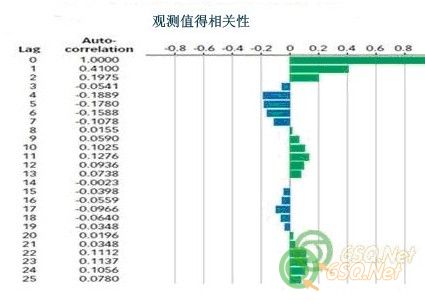
Digging a little deeper, we can examine the autocorrelations representing the data up to observation 475. The correlogram is shown in Figure 2. Notice a few high peaks at the early lags, then a damping oscillation. For those in the know about time-series modeling, that is a tipoff about the kind of modeling that should be done.
更深一步,我们可以仔细的检查475次观察之前的数据的自相关。图2是相关图。注意几个早期衰退的尖峰,接着是逐渐衰减的振动。对于那些已知的时间序列模型而言,那是这类建模应该要要做的事情的一个开始。
The message is that we should look at a model of the form:
要点是我们应该看看下面形式的模型:
Xt = c0 + c1Xt– 1 + c2Xt– 2 + … + εt
in which:
这里:
• Xt is the predicted value at time t.
Xt是在时间t的预测值
• Xt - 1, Xt - 2 … are observed values at times t - 1, t - 2, and so on.
Xt - 1, Xt - 2 …是在时间t - 1, t - 2,的观测值,以此类推
• c0 is a constant representing the mean of the series.
c0是代表序列均值的一个常量
• c1, c2, … are coefficients estimated from the data.
c1, c2, … 是依据数据估计出来的系数
• εt is the error at time t (the difference between the observed and the predicted values
εt是时间t的误差(观测值和预测值的差)
This is called an autoregressive model because it regresses observations on their predecessors. When the model is fit to the data, the autoregressive coefficients up to and including the fourth order (lag) are found to be statistically significant while those above that order are not as shown in Table 1.
这被称为自回归模型,因为它返回观测值到它前任上。当这个模型拟合数据时,自回归系数直到(含)第四个(lag 4)时间段是统计显著的,上面的那些数据没有在表1中显示出来。
The suggestion is that the homogenizer’s "memory" lasts about four seconds. That information gives rise to the question, "What part of the process upstream of the homogenizer might cause such memory?" Is there a pump with a pulse of about four seconds? A mixer with four components to it? We don’t know, but we have some clues to fuel detective work.
这暗示这个搅匀器的“记忆”保持大概4秒。这个信息引出了下面的问题:“搅匀器上游过程的什么部分可能引起这样的记忆呢?”是一个有大概4秒间隔的泵吗?一个四组分混合器?我们不知道,但是我们有了一些有用的线索。
Another key finding from this time-series modeling effort is that the residual standard deviation is 1.90. This estimate of inherent, intrinsic capability is down from the passive, initial estimate of 3.02 and the reduced estimate stemming from elimination of observations following an obvious process change. It points to an opportunity for improvement of a process initially thought to be stable.
在这个时间序列建模成果中,另一个关键的发现是标准残差为1.90。 这个内在固有能力的估计是从最初消极的估计值3.02减少后得到的,这个估计的减少是因为删除了伴随着明显的过程变化的观测值。这指出了一个改进开始被认为是稳定的过程的机会。
The point is that modeling helps identify causality, determine underlying process capability or both. Any way you look at it, it builds process knowledge.
重点是建模帮助你识别因果关系,决定潜在的过程能力,或者两者兼有。不管怎么看,它都构建了对过程得认知。
And that’s what will make you smarter than your average bear.
那会让你比你一般的同僚更聪明一些。
________________________________________
Notes
2、参考Lynne B. Hare的数据分析第一原则:“永远,永远,永远绘制没有任何异常的数据图——并且观察这个图”。而你已经知道这一点了。
Acknowledgements
鸣谢:
Thanks to JMP for use of its software and Keith Eberhardt and Mark Vandeven for careful reading and tactfully placed suggestions.
鸣谢JMP提供的软件;鸣谢Keith Eberhardt和Mark Vandeven的仔细阅读和巧妙的建议。
________________________________________
Lynne B. Hare is a statistical consultant. He holds a doctorate in statistics from Rutgers University in New Brunswick, NJ. Hare is past chairman of the ASQ Statistics Division and a fellow of both ASQ and the American Statistical Association.
Lynne B. Hare是一个统计咨询师。他在新泽西州新宾士威克大学获得统计学博士学位。Hare是ASQ统计分部的前主席,也是ASQ和美国统计学会的成员。
________________________________________

本文由liphking 翻译 spear校稿
Why Statisticians Model Data
How this intrinsic behavior helps build process knowledge
为什么统计学家给数据建模
这个内在行为怎样帮助建立对过程的认知
by Lynne B. Hare
What follows is an apology. Not an apology as in "I’m sorry," but an apology as a justification or explanation.
接下来是一个道歉。不是“对不起”的那种,而是一个理由或者解释。
You might be thinking it shouldn’t be necessary to explain why statisticians model data. It is just their nature. Why do dogs sniff bushes? Why do cats rub up against legs? Why do bears … well, you get the idea.
你可能会觉得没什么必要来解释为什么统计学家会给数据建模。这只是他们的本性,为什么小狗会在灌木丛中嗅来嗅去?为什么小猫会挠腿?为什么熊…好了,你懂的。
The statistician’s behavior may have been learned and then embedded during graduate school and throughout his or her subsequent career—you’ll get no argument from me there. But it is not nearly as mindless or knee-jerk as you might think.
统计学家的这种行为可能是在上大学期间和其后的工作中学到的并得到了强化——这里我不和你争论。但是这不像你可能想象的那样,是无心的或者下意识的。
There are at least two main reasons for data modeling behavior. The more obvious is to learn about variables or factors that influence responses of interest.
给数据建模至少有两个主要的理由。更明显一个,是来了解影响相关响应的变量或因素。
Take as examples the decay of active drug ingredients and the efficacy of certain surfactants in body washes. In the first example, the goal is to learn the effects of time, storage conditions and packaging materials on stability.
比如,有效药物成分的衰减和沐浴露中特定表面活性剂的效果。第一个示例的目的是了解时间、贮存环境和包装材料对稳定性的影响。
In the second, the goal is to determine which surfactants, acting along or in combination and at various proportions of the mix, will be responsible for the greatest efficacy.
第二个示例,目的是用来确定哪些单独或者以各种不同的配比混合使用的表面活性剂会产生最好的效果。
Neither of these goals can be met without modeling data. Both goals are important to the businesses involved, and no one is better positioned to meet them than statisticians.
这两个目的都离不开给数据建模。这两个目标对相关的经营都很重要,而没有人比统计学家更适合干这个的了。
But a second reason for data modeling behavior is as important as the first, and it is applicable to all types of processes. A key element of process improvement is the quantification of process capability. I’m not talking about your father’s Cp or Cpk, but rather about getting down to the inherent, intrinsic variation due to the interface between equipment and raw materials in manufacturing or due to common causes of variation in the service sector.
但是,给数据建模的第二个原因跟第一个同样重要, 并且他适用于各种各样的过程。 过程改进的一个关键要素是量化过程的能力。我跟你说的不是老一辈的那些Cp或者Cpk,而是深入的探究内在的固有的变异,这些变异源于制造过程中设备和原材料的配合或者服务领域的变异的一般原因。
Modeling can help strip away most—if not all—of the assignable causes, leaving a residual variation that represents capability. After capability is estimated, anything that departs from it should be met with intolerance because it gets in the way of performance at its best.
给数据建模可以帮助剥离绝大部分的——如果不是全部——可分配原因(特殊原因),留下一个代表过程能力的残差。过程能力估计出来以后,对任何偏离该值的情况都是不可容忍的,因为这阻止了绩效最大化。
Modeling benefits
建模的好处
Here is an example that does both. It points to potential causal relationships, and it whittles down the total variation to unveil the inherent, intrinsic variation.
下面的示例解释了这两个原因。它指出了潜在的因果关系,也逐渐减少了总变异来揭示出内在的固有的变异。
There is an inline homogenization device—with multiple input and output streams—which mixes ingredients (homogeneously) into hand cream. Some really capable engineers have gotten hold of it as evidenced by its ability to output the amount passed through the streams in millisecond intervals. That’s fast, and it is tempting to turn this monster on and see what it does.
这里是一个在线的均匀化设备——有多个输入和输出流——它把原料搅匀成护手霜。一些能干的工程师找到了它,见证了它以毫秒的间隔输出的能力。那么,接下来打开这个怪兽来看看他到底能干什么是很诱人的。
But a statistical red flag goes up: Do we really need data in millisecond intervals, and wouldn’t they be highly correlated if we had them? That is, wouldn’t high amounts be followed by other high amounts, and wouldn’t lows be followed by lows?
但是一个统计的危险信号出现了:我们真的需要以毫秒为间隔的数据吗?如果我们有了这些,它们不是会高度地相互关联吗?不是一个高的数量紧接着另一个高的数量吗,低的也会紧接着另一个低的?
A local engineer mentioned the reporting interval could be scaled back to one second. As a result, a one-second interval was chosen instead of the default interval, even though the same kind of correlation, called autocorrelation,1 would be expected (although to a lesser extent
一个本地的工程师指出报告的间隔时间可以被按比例调整到1秒。结果是,1秒被用来作为默认间隔。即使同种类型的相互关联称为自相关,也是值得期待的(虽然不是很强烈)。
Throwing caution to the wind, we started the homogenizer and let it run until an expert said it had reached equilibrium. I’m not sure what that means, but he had a wrench in his hand, so I didn’t ask. We let it run for a little more than 10 minutes, output the homogenizer’s data into a laptop and plotted the data2 in a simple run chart, as shown in Figure 1.
抛开顾虑,我们开启了这个搅匀器,让它运转直到一个专家说它已经达到平衡。我不知道这是什么意思,但是他手里有个扳手,我也就没再问。我们让它运行了10分钟稍微多一点,把搅匀器的数据输出到电脑上并做成一个简单运行图,如图1所示。
It seems pretty clear that the amounts delivered by the homogenizer are not stable over time. For example, look at the final group of observations beginning at about the 475th observation. Why are they so much more scattered than the earlier observations? We don’t know, of course, but clearly something happened. An increase in variation such as that could not have happened by chance alone.
看起来相当明显,搅匀器的输出量随着时间的推移并不稳定。比如,观察从第475次开始的最后一组观测值,为什么它们比前面的观察数据分散的多?我们不知道,但是很显然出现异常状况了。像这样的变异增加不会只是随机出现的。
If we had failed to plot the data and instead had taken them on blind faith (heaven forbid), we would have calculated a standard deviation of 3.02. Eliminating the observations beyond the 475th brings the standard deviation down to 2.14. That’s a considerable step toward getting to the inherent, intrinsic variation. We could eliminate other segments of the data as well, but the more we do that, the more we risk making arbitrary decisions.
如果我们没能绘出这些数据图表,而是靠着盲目的信心(但愿不会这样),就会计算得到标准差为3.02。删掉475次以后的观察数据,就把标准差降低到2.14。这向得到内在的固有变异迈出了重要的一大步。我们也可以删掉其他的数据段,但是这样做得越多得出武断决定的风险就越高。
Autoregressive model
自回归模型
Digging a little deeper, we can examine the autocorrelations representing the data up to observation 475. The correlogram is shown in Figure 2. Notice a few high peaks at the early lags, then a damping oscillation. For those in the know about time-series modeling, that is a tipoff about the kind of modeling that should be done.
更深一步,我们可以仔细的检查475次观察之前的数据的自相关。图2是相关图。注意几个早期衰退的尖峰,接着是逐渐衰减的振动。对于那些已知的时间序列模型而言,那是这类建模应该要要做的事情的一个开始。
The message is that we should look at a model of the form:
要点是我们应该看看下面形式的模型:
Xt = c0 + c1Xt– 1 + c2Xt– 2 + … + εt
in which:
这里:
• Xt is the predicted value at time t.
Xt是在时间t的预测值
• Xt - 1, Xt - 2 … are observed values at times t - 1, t - 2, and so on.
Xt - 1, Xt - 2 …是在时间t - 1, t - 2,的观测值,以此类推
• c0 is a constant representing the mean of the series.
c0是代表序列均值的一个常量
• c1, c2, … are coefficients estimated from the data.
c1, c2, … 是依据数据估计出来的系数
• εt is the error at time t (the difference between the observed and the predicted values
εt是时间t的误差(观测值和预测值的差)
This is called an autoregressive model because it regresses observations on their predecessors. When the model is fit to the data, the autoregressive coefficients up to and including the fourth order (lag) are found to be statistically significant while those above that order are not as shown in Table 1.
这被称为自回归模型,因为它返回观测值到它前任上。当这个模型拟合数据时,自回归系数直到(含)第四个(lag 4)时间段是统计显著的,上面的那些数据没有在表1中显示出来。
The suggestion is that the homogenizer’s "memory" lasts about four seconds. That information gives rise to the question, "What part of the process upstream of the homogenizer might cause such memory?" Is there a pump with a pulse of about four seconds? A mixer with four components to it? We don’t know, but we have some clues to fuel detective work.
这暗示这个搅匀器的“记忆”保持大概4秒。这个信息引出了下面的问题:“搅匀器上游过程的什么部分可能引起这样的记忆呢?”是一个有大概4秒间隔的泵吗?一个四组分混合器?我们不知道,但是我们有了一些有用的线索。
Another key finding from this time-series modeling effort is that the residual standard deviation is 1.90. This estimate of inherent, intrinsic capability is down from the passive, initial estimate of 3.02 and the reduced estimate stemming from elimination of observations following an obvious process change. It points to an opportunity for improvement of a process initially thought to be stable.
在这个时间序列建模成果中,另一个关键的发现是标准残差为1.90。 这个内在固有能力的估计是从最初消极的估计值3.02减少后得到的,这个估计的减少是因为删除了伴随着明显的过程变化的观测值。这指出了一个改进开始被认为是稳定的过程的机会。
The point is that modeling helps identify causality, determine underlying process capability or both. Any way you look at it, it builds process knowledge.
重点是建模帮助你识别因果关系,决定潜在的过程能力,或者两者兼有。不管怎么看,它都构建了对过程得认知。
And that’s what will make you smarter than your average bear.
那会让你比你一般的同僚更聪明一些。
________________________________________
Notes
- To calculate an autocorrelation, write down the output numbers in one column, then rewrite them in a second column, but shifted down one row, leaving a blank in the first row of the second column. If you calculate the correlation coefficient of the numbers in the first and second column, ignoring blanks, you will have the autocorrelation of lag 1. Do it again, but move the new column down two rows, and you will have an autocorrelation of lag 2. You can continue this for many lags, assuming your data set is long enough. If you plot the value of the correlation on the y axis against the lag on the x axis, you have a corellogram.
- 计算一个自相关,在一列中写下输出结果,然后在第二列中重复写入同样的数据,只是向下移动一行,把第二列的第一行留空。如果你计算一二列数字的相关系数,忽略留空的格子,你将得到时间段1的自相关。以此类推,新的一列要向下移动2行,你能得到第二个时间段的自相关,你可以继续这样做很多个时间段,只要你的数据足够长。如果你以这些相关的数值为y坐标,以时间间隔为x坐标描点作图,就能得到一个相关图。
- Refer to Lynne B. Hare’s first law of data analysis: "Always, always, always, without exception plot the data—and look at the plot." But you know that already.
2、参考Lynne B. Hare的数据分析第一原则:“永远,永远,永远绘制没有任何异常的数据图——并且观察这个图”。而你已经知道这一点了。
Acknowledgements
鸣谢:
Thanks to JMP for use of its software and Keith Eberhardt and Mark Vandeven for careful reading and tactfully placed suggestions.
鸣谢JMP提供的软件;鸣谢Keith Eberhardt和Mark Vandeven的仔细阅读和巧妙的建议。
________________________________________
Lynne B. Hare is a statistical consultant. He holds a doctorate in statistics from Rutgers University in New Brunswick, NJ. Hare is past chairman of the ASQ Statistics Division and a fellow of both ASQ and the American Statistical Association.
Lynne B. Hare是一个统计咨询师。他在新泽西州新宾士威克大学获得统计学博士学位。Hare是ASQ统计分部的前主席,也是ASQ和美国统计学会的成员。
________________________________________
没有找到相关结果
已邀请:


1 个回复
小编D (威望:9) (广东 广州) 互联网 员工 - 记住该记住的,忘记改忘记的。改变能改变的,接受不...
赞同来自:
本文由liphking 翻译 spear校稿