
第二十篇 Design of Experiments – A Primer
本帖最后由 小编D 于 2012-4-26 16:22 编辑
本文由spear翻译,xy_persist校稿
Design of Experiments – A Primer试验设计——初阶
Understanding the terms and concepts that are part of a DOE can help practitioners be better prepared to use the statistical tool.
理解作为DOE组成部分的术语和概念能帮助试验者更好地策划使用统计工具。
By K. Sundararajan
Design of experiments (DOE) is a systematic method to determine the relationship between factors affecting a process and the output of that process. In other words, it is used to find cause-and-effect relationships. This information is needed to manage process inputs in order to optimize the output.
试验设计(DOE)是一种确定影响过程的因子和过程输出之间的关系的动态方法。换句话说,试验设计常用来寻找因果关系。为了优化输出对过程输入进行管理时,这些信息是必要的。。
An understanding of DOE first requires knowledge of some statistical tools and experimentation concepts. Although a DOE can be analyzed in many software programs, it is important for practitioners to understand basic DOE concepts for proper application.
对DOE的理解首先需要一些统计工具的知识和试验的概念。虽然可以使用很多软件程序来分析DOE,但是对于试验者来说,理解基本的DOE概念对于DOE的正确应用是很重要的。
Common DOE Terms and Concepts
常用的DOE术语和概念
The most commonly used terms in the DOE methodology include: controllable and uncontrollable input factors, responses, hypothesis testing, blocking, replication and interaction.
DOE方法论中最常使用的术语包括:可控的和不可控的输入因子,响应,假设检验,模块(区组化),重复(反复)和交互作用。
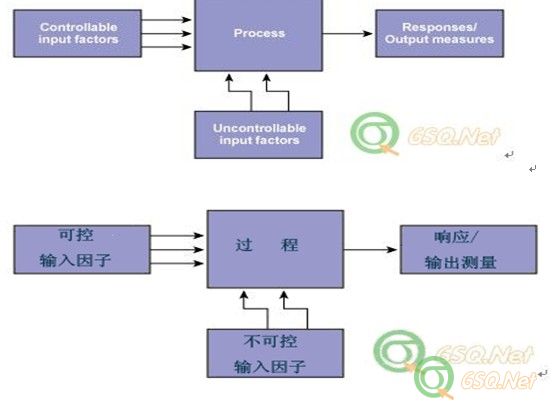
•Controllable input factors, or x factors, are those input parameters that can be modified in an experiment or process. For example, in cooking rice, these factors include the quantity and quality of the rice and the quantity of water used for boiling.
可控的输入因子,或者称x因子,是那些在一个试验或者过程中可以改变的输入参数。例如,在蒸米饭时,这些因子包括大米的数量和质量以及用加水量。
•Uncontrollable input factors are those parameters that cannot be changed. In the rice-cooking example, this may be the temperature in the kitchen. These factors need to be recognized to understand how they may affect the response.
不可控输入因子,是那些不能改变的参数。在蒸米饭的例子中,这个参数可以是厨房的温度。需要识别这些(不可控)因子,以便弄明白它们是如何影响响应的。
•Responses, or output measures, are the elements of the process outcome that gage the desired effect. In the cooking example, the taste and texture of the rice are the responses.
响应,或者输出测量值,是判断期望效果的过程输出要素。在蒸米饭的例子中,米饭的味道和口感就是响应。
The controllable input factors can be modified to optimize the output. The relationship between the factors and responses is shown in Figure 1.
可以通过变更输入因子来优化输出。因子和响应之间的关系如图1所示。
Figure 1: Process Factors and Responses
图1: 过程因子和响应
•Hypothesis testing helps determine the significant factors using statistical methods. There are two possibilities in a hypothesis statement: the null and the alternative. The null hypothesis is valid if the status quo is true. The alternative hypothesis is true if the status quo is not valid. Testing is done at a level of significance, which is based on a probability.
假设检验(假设验证)使用统计方法来帮助确定显著影响因子。一个假设的表达方式有两种:归无假设和对立假设。如果假设结果为真则归无假设成立,否则假设结果不成立则对立假设为真。。检验是基于一定的概率在一个显著的水平上进行的。
•Blocking and replication: Blocking is an experimental technique to avoid any unwanted variations in the input or experimental process. For example, an experiment may be conducted with the same equipment to avoid any equipment variations. Practitioners also replicate experiments, performing the same combination run more than once, in order to get an estimate for the amount of random error that could be part of the process.
区组化合反复:区组化是一种在输入或者试验过程中避免不希望的波动影响的试验技术。例如,实验过程中可以进行以下控制:采用同一台设备进行实验以避免设备造成的波动;实验者进行重复实验,同样的顺序进行组合实验而不是仅做一次实验,为了评估随机误差的数量这些都应该是实验过程的一部分。
•Interaction: When an experiment has three or more variables, an interaction is a situation in which the simultaneous influence of two variables on a third is not additive.
交互作用:当试验有三个或者更多变量时,交互作用是这么一种情况——在这种情况下,两个变量对第三个变量同时产生影响,而且这个影响不是附加的。
A Simple One-factor Experiment
单因子试验
The comparison of two or more levels in a factor can be done using an F-test. This compares the variance of the means of different factor levels with the individual variances, using this equation:
F检验能用来做一个因子的两个或者多个水平的比较。使用下面的等式能够比较具有独立方差的不同因子水平的均值的方差,:
F = ns2Y-bar / s2pooled
where:
这里:
n = the sample size
n=样本大小
s2Y-bar = the variance of the means, which is calculated by dividing the sum of variances of the individual means by the degrees of freedom
s2Y-bar =均值的方差,其由独立均值的方差和除以自由度得到
s2pooled = pooled variance, or the average of the individual variances
s2pooled =联合方差,或者独立方差的均值
This is similar to the signal-to-noise ratio used in electronics. If the value of F (the test statistic) is greater than the F-critical value, it means there is a significant difference between the levels, or one level is giving a response that is different from the others. Caution is also needed to ensure that s2pooled is kept to a minimum, as it is the noise or error term. If the F value is high, the probability (p-value)will fall below 0.05, indicating that there is a significant difference between levels. The value of 0.05 is a typical accepted risk value.
这与电子工程学中的信噪比相似。如果F检验值(试验统计所得)比特征值F大,就表示在几个水平之间有显著差异,或者说一个水平给出的响应与别的水平不同。值得注意的是同时需要保证s2pooled为最小值,可将其视为噪声或者误差。如果F值高,(p值)概率会低于0.05,表明在各水平之间有显著差异。这个0.05是一个典型的可接受风险值。
If F = 1, it means the factor has no effect.
如果F=1,那么因子不显著(没有影响)。
As an example of a one-factor experiment, data from an incoming shipment of a product is given in Table 1.
作为单因子试验的例子,在表1中给出了来自于某产品的进口船运数据。
Table 1: Incoming Shipment Data
表1:进口船运数据
Lot
船
Data
数据
A
61, 61, 57, 56, 60, 52, 62, 59, 62, 67, 55, 56, 52, 60, 59, 59, 60, 59, 49, 42, 55, 67, 53, 66, 60
B
56, 56, 61, 67, 58, 63, 56, 60, 55, 46, 62, 65, 63, 59, 60, 60, 59, 60, 65, 65, 62, 51, 62, 52, 58
C
62, 62, 72, 63, 51, 65, 62, 59, 62, 63, 68, 64, 67, 60, 59, 59, 61, 58, 65, 64, 70, 63, 68, 62, 61
D
70, 70, 50, 68, 71, 65, 70, 73, 70, 69, 64, 68, 65, 72, 73, 75, 72, 75, 64, 69, 60, 68, 66, 69, 72
When a practitioner completes an analysis of variance(ANOVA), the following results are obtained:
当试验者在完成方差分析(ANOVA)时,会得到如下结果:
Table 2: ANOVA Summary
表2:ANOVA 汇总
Groups
分组
Count
次数
Sum
合计
Average
均值
Variance
方差
A
25
1,449
57.96
31.54
B
25
1,483
59.32
23.14333
C
25
1,570
62.80
18.5
D
25
1,708
68.32
27.64333
ANOVA
方差分析
Source of Variation
方差源
SS
df
自由度
MS
F
p-value
p-值
F-crit
Between groups
组间方差
1,601.16
3
533.72
21.17376
1.31 x 10⁻¹⁰
2.699394
Within groups
组内方差
2,419.84
96
25.20667
Total
合计
4,021
99
Statistical software can provide hypothesis testing and give the actual value of F. If the value is below the critical F value, a value based on the accepted risk, then the null hypothesis is not rejected. Otherwise, the null hypothesis is rejected to confirm that there is a relationship between the factor and the response. Table 2 shows that the F is high, so there is a significant variation in the data. The practitioner can conclude that there is a difference in the lot means.
统计软件能够进行假设验证,并给出实际的F值。如果这个值比基于可接受的风险判定F值低,那么归无假设就不能放弃。反之,归无假设放弃就证明因子和响应之间有关系。表2显示:F值高,那么在数据中就存在显著变化。试验者能够判断出这些船运数量的均值之间的是有差异的。
Two-level Factorial Design
两水平因子设计
This is the most important design for experimentation. It is used in most experiments because it is simple, versatile and can be used for many factors. In this design, the factors are varied at two levels – low and high.
对试验来说这是最重要的设计。因为其简单、实用性强,而且适用于多因子,大多数实验都会用到两水平因子设计。。在本设计中,因子选择两个水平——低和高。
Two-level designs have many advantages. Two are:
两水平因子设计有许多优点,其中两个是:
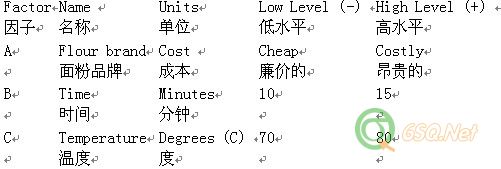
For an example of a two-level factorial design, consider the cake-baking process. Three factors are studied: the brand of flour, the temperature of baking and the baking time. The associated lows and highs of these factors are listed in Table 3.
将蛋糕烘焙过程为例进行两水平因子设计,需要考察三个因子:面粉的品牌,烘焙的温度,烘焙的时间。在表3种列出了这三个因子的相关联的低和高水平情况。
Table 3: Cake-baking Factors and Their Associated Levels
表3: 蛋糕烘焙因子以及相关水平
注:面粉品牌对应的单位 Cost以为价格或费用可能会更好一点
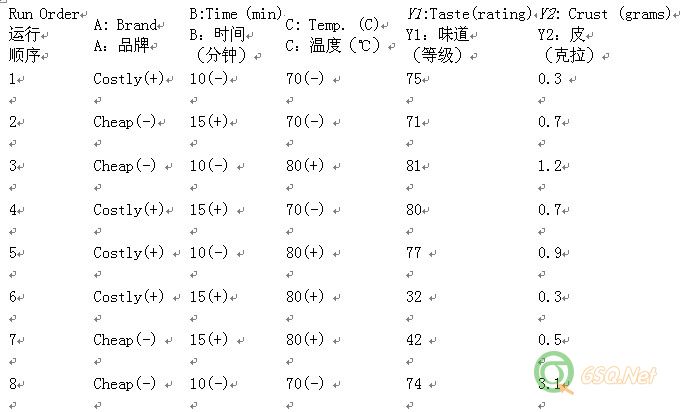
The output responses considered are “taste” and “crust formation.” Taste was determined by a panel of experts, who rated the cake on a scale of 1 (worst) to 10 (best).The ratings were averaged and multiplied by 10. Crust formation is measured by the weight of the crust, the lower the better.
作为输出响应的是“味道”和“外皮外观”。味道由一个专家评论小组确定,他们给蛋糕从1(最坏)到10(最好)进行评级。等级为平均数乘以10。蛋糕外皮的外观由外皮的重量来标定,重量越轻越好。
The experiment design, with the responses, is shown in Table 4.
在表4中,列出了实验设计及其响应。
Table 4: Settings of Input Factors and the Resulting Responses
表4: 输入因子的设置及后果响应
注:外皮的单位应该是 克
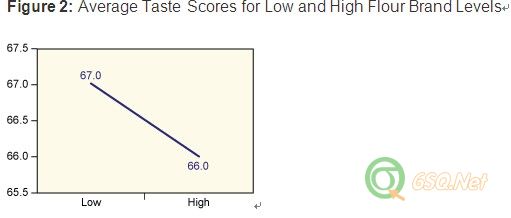
Analysis of the results is shown in Table 5. Figures 2 through 4 show the average taste scores for each factor as it changes from low to high levels. Figures 5 through 7 are interaction plots; they show the effect of the combined manipulation of the factors.
结果分析列在表5中(见表5)。图2到图4显示出每个因子由低水平到高水平变化时的平均味道等级。图5到图7是交互作用图;它们显示出这些因子综合作用的影响。
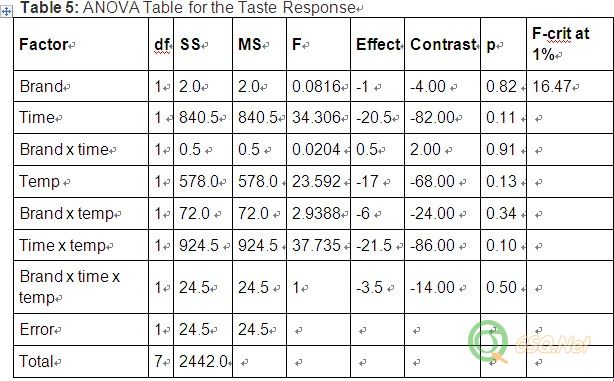
Table 5: ANOVA Table for the Taste Response
表5: 味道响应的方差分析表
Figure 2: Average Taste Scores for Low and High Flour Brand Levels
图2: 面粉品牌水平由低到高的平均味道等级
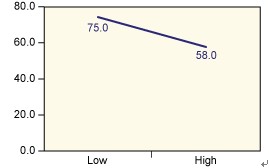
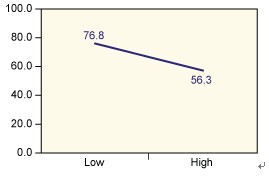
Figure 3: Average Taste Scores for Low and High Bake Time(Minutes) Levels图3: 烘焙时间(分钟)水平由低到高的平均味道等级
Figure 4: Average Taste Scores for Low and High Baking Temperature(C) Levels图4: 烘焙温度(℃)水平由低到高的平均味道等级
Figure 5: Average Taste Scores for Flour Brand by Time(Minutes)图5: 面粉品牌和时间(分钟)交互作用下的平均味道等级
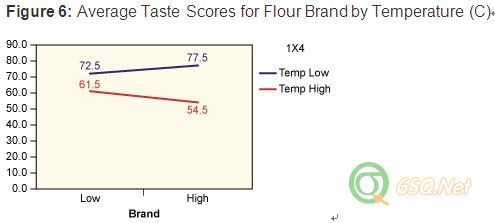
Figure 6: Average Taste Scores for Flour Brand byTemperature (C)
图6: 面粉品牌和温度(℃)交互作用下的平均味道等级
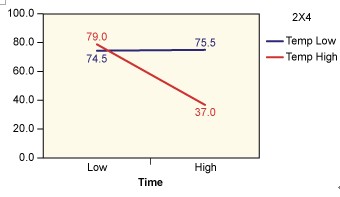
Figure 7: Average Taste Scores for Time (Minutes) byTemperature (C)
图7: 时间(分钟)和温度(℃)交互作用下的平均味道等级
From reading an F table, the critical F value at 1 percent is16.47. As the actual value of F for time and temperature exceed this value(time is at 34.306 and temperature is 23.592), it’s possible to conclude that both of them have a significant effect on the taste of the product. This is also evident from Figures 3 and 4, where the line is steep for the variation of these two factors. Figure 7 also shows that when the temperature is high, the taste sharply decreases with time (as charring takes place)
从F值表可知,在1%处F特征值为16.47。由于时间和温度的,实际F值超过这个特征值(时间为34.36,温度为23.592),很大可能断定时间和温度对产品的味道有显著的影响。这也能在图3和图4得到证据,这两个因子的方差图线是陡峭的。图7也显示出当温度高时,随着烘焙时间的增加,蛋糕的味道急剧下降(发生碳化)。
For the crust formation, the data analysis is shown in Table 6.
表6中列出了对外皮情况的数据分析
Table 6: ANOVA Table for the Crust Response
表6: 外皮响应的方差分析表
Factor
因子
df
自由度
SS
MS
F
Effect
Contrast
对比
F-crit at 1%
在1%处关键值
Brand
品牌
1
1.4
1.4
1.4938
-0.825
-3.30
16.47
Time
时间
1
1.4
1.4
1.4938
-0.825
-3.30
Brand x time
品牌x时间
1
1.1
1.1
1.1536
0.725
2.90
Temp
温度
1
0.5
0.5
0.4952
-0.475
-1.90
Brand x temp
品牌x温度
1
0.7
0.7
0.7257
0.575
2.30
Time x temp
时间x温度
1
0.1
0.1
0.0672
0.175
0.70
Brand x time x temp
品牌x时间x温度
1
0.9
0.9
1
-0.675
-2.70
Error
误差
1
0.9
0.9
Total
总计
7
5.9
In this case the actual F value for the three factors(brand, time and temperature) are below the critical F value for 1 percent(16.47 )。This shows that these are not significant factors for the crust formation in the cake. If further optimization of the crust formation is needed, then other factors, such as the quantity of ingredients in the cake(eggs, sugar and so on), should be checked.
在这个案例中,三个因子(面粉品牌,烘焙时间和烘焙温度)的实际F值均低于在1%处特征F值。这表明这些因子对蛋糕的外皮外观来说不是显著因子。如果需要进一步优化外皮外观,应该对其他的因子如蛋糕中的原料(如鸡蛋,糖等等)的质量进行验证。
Versatile Tool for Practitioners
实试验者的多功能工具
Design of experiments is a powerful tool in Six Sigma to manage the significant input factors in order to optimize the desired output. Factorial experiments are versatile because many factors can be modified and studied at once. The following resources can be helpful in learning more about DOEs:
试验设计是一个强有力的6Sigma工具,用来控制特征输入因子来优化所期望的输出。因为许多因子可以进行一次性的改动和研究,实际试验是多样的。下面的资源在更多地了解DOE时会很有帮助的:
About the Author: K. Sundararajan is the regional quality assurance director, greater Asia, for International Flavours and Fragrances Inc. He is a Black Belt and has been a trainer and practicing quality professional for more than 20 years. He can be reached at mailto:k.sundararajan@iff.com This e-mail address is being protected from spambots. You need JavaScript enabled to view it .
关于作者:K. Sundararajan 是International Flavours and Fragrances 公司大亚细亚区的区域品保主管。作为一个黑带,拥有超过20年质量专业的培训和实践经验。可以通过电子邮件联系他:mailto:k.sundararajan@iff.com。为了防止该邮件被处理成垃圾邮件,你需要使用JavaScript才能进行浏览。

本文由spear翻译,xy_persist校稿
Design of Experiments – A Primer试验设计——初阶
Understanding the terms and concepts that are part of a DOE can help practitioners be better prepared to use the statistical tool.
理解作为DOE组成部分的术语和概念能帮助试验者更好地策划使用统计工具。
By K. Sundararajan
Design of experiments (DOE) is a systematic method to determine the relationship between factors affecting a process and the output of that process. In other words, it is used to find cause-and-effect relationships. This information is needed to manage process inputs in order to optimize the output.
试验设计(DOE)是一种确定影响过程的因子和过程输出之间的关系的动态方法。换句话说,试验设计常用来寻找因果关系。为了优化输出对过程输入进行管理时,这些信息是必要的。。
An understanding of DOE first requires knowledge of some statistical tools and experimentation concepts. Although a DOE can be analyzed in many software programs, it is important for practitioners to understand basic DOE concepts for proper application.
对DOE的理解首先需要一些统计工具的知识和试验的概念。虽然可以使用很多软件程序来分析DOE,但是对于试验者来说,理解基本的DOE概念对于DOE的正确应用是很重要的。
Common DOE Terms and Concepts
常用的DOE术语和概念
The most commonly used terms in the DOE methodology include: controllable and uncontrollable input factors, responses, hypothesis testing, blocking, replication and interaction.
DOE方法论中最常使用的术语包括:可控的和不可控的输入因子,响应,假设检验,模块(区组化),重复(反复)和交互作用。
•Controllable input factors, or x factors, are those input parameters that can be modified in an experiment or process. For example, in cooking rice, these factors include the quantity and quality of the rice and the quantity of water used for boiling.
可控的输入因子,或者称x因子,是那些在一个试验或者过程中可以改变的输入参数。例如,在蒸米饭时,这些因子包括大米的数量和质量以及用加水量。
•Uncontrollable input factors are those parameters that cannot be changed. In the rice-cooking example, this may be the temperature in the kitchen. These factors need to be recognized to understand how they may affect the response.
不可控输入因子,是那些不能改变的参数。在蒸米饭的例子中,这个参数可以是厨房的温度。需要识别这些(不可控)因子,以便弄明白它们是如何影响响应的。
•Responses, or output measures, are the elements of the process outcome that gage the desired effect. In the cooking example, the taste and texture of the rice are the responses.
响应,或者输出测量值,是判断期望效果的过程输出要素。在蒸米饭的例子中,米饭的味道和口感就是响应。
The controllable input factors can be modified to optimize the output. The relationship between the factors and responses is shown in Figure 1.
可以通过变更输入因子来优化输出。因子和响应之间的关系如图1所示。
Figure 1: Process Factors and Responses
图1: 过程因子和响应
•Hypothesis testing helps determine the significant factors using statistical methods. There are two possibilities in a hypothesis statement: the null and the alternative. The null hypothesis is valid if the status quo is true. The alternative hypothesis is true if the status quo is not valid. Testing is done at a level of significance, which is based on a probability.
假设检验(假设验证)使用统计方法来帮助确定显著影响因子。一个假设的表达方式有两种:归无假设和对立假设。如果假设结果为真则归无假设成立,否则假设结果不成立则对立假设为真。。检验是基于一定的概率在一个显著的水平上进行的。
•Blocking and replication: Blocking is an experimental technique to avoid any unwanted variations in the input or experimental process. For example, an experiment may be conducted with the same equipment to avoid any equipment variations. Practitioners also replicate experiments, performing the same combination run more than once, in order to get an estimate for the amount of random error that could be part of the process.
区组化合反复:区组化是一种在输入或者试验过程中避免不希望的波动影响的试验技术。例如,实验过程中可以进行以下控制:采用同一台设备进行实验以避免设备造成的波动;实验者进行重复实验,同样的顺序进行组合实验而不是仅做一次实验,为了评估随机误差的数量这些都应该是实验过程的一部分。
•Interaction: When an experiment has three or more variables, an interaction is a situation in which the simultaneous influence of two variables on a third is not additive.
交互作用:当试验有三个或者更多变量时,交互作用是这么一种情况——在这种情况下,两个变量对第三个变量同时产生影响,而且这个影响不是附加的。
A Simple One-factor Experiment
单因子试验
The comparison of two or more levels in a factor can be done using an F-test. This compares the variance of the means of different factor levels with the individual variances, using this equation:
F检验能用来做一个因子的两个或者多个水平的比较。使用下面的等式能够比较具有独立方差的不同因子水平的均值的方差,:
F = ns2Y-bar / s2pooled
where:
这里:
n = the sample size
n=样本大小
s2Y-bar = the variance of the means, which is calculated by dividing the sum of variances of the individual means by the degrees of freedom
s2Y-bar =均值的方差,其由独立均值的方差和除以自由度得到
s2pooled = pooled variance, or the average of the individual variances
s2pooled =联合方差,或者独立方差的均值
This is similar to the signal-to-noise ratio used in electronics. If the value of F (the test statistic) is greater than the F-critical value, it means there is a significant difference between the levels, or one level is giving a response that is different from the others. Caution is also needed to ensure that s2pooled is kept to a minimum, as it is the noise or error term. If the F value is high, the probability (p-value)will fall below 0.05, indicating that there is a significant difference between levels. The value of 0.05 is a typical accepted risk value.
这与电子工程学中的信噪比相似。如果F检验值(试验统计所得)比特征值F大,就表示在几个水平之间有显著差异,或者说一个水平给出的响应与别的水平不同。值得注意的是同时需要保证s2pooled为最小值,可将其视为噪声或者误差。如果F值高,(p值)概率会低于0.05,表明在各水平之间有显著差异。这个0.05是一个典型的可接受风险值。
If F = 1, it means the factor has no effect.
如果F=1,那么因子不显著(没有影响)。
As an example of a one-factor experiment, data from an incoming shipment of a product is given in Table 1.
作为单因子试验的例子,在表1中给出了来自于某产品的进口船运数据。
Table 1: Incoming Shipment Data
表1:进口船运数据
Lot
船
Data
数据
A
61, 61, 57, 56, 60, 52, 62, 59, 62, 67, 55, 56, 52, 60, 59, 59, 60, 59, 49, 42, 55, 67, 53, 66, 60
B
56, 56, 61, 67, 58, 63, 56, 60, 55, 46, 62, 65, 63, 59, 60, 60, 59, 60, 65, 65, 62, 51, 62, 52, 58
C
62, 62, 72, 63, 51, 65, 62, 59, 62, 63, 68, 64, 67, 60, 59, 59, 61, 58, 65, 64, 70, 63, 68, 62, 61
D
70, 70, 50, 68, 71, 65, 70, 73, 70, 69, 64, 68, 65, 72, 73, 75, 72, 75, 64, 69, 60, 68, 66, 69, 72
When a practitioner completes an analysis of variance(ANOVA), the following results are obtained:
当试验者在完成方差分析(ANOVA)时,会得到如下结果:
Table 2: ANOVA Summary
表2:ANOVA 汇总
Groups
分组
Count
次数
Sum
合计
Average
均值
Variance
方差
A
25
1,449
57.96
31.54
B
25
1,483
59.32
23.14333
C
25
1,570
62.80
18.5
D
25
1,708
68.32
27.64333
ANOVA
方差分析
Source of Variation
方差源
SS
df
自由度
MS
F
p-value
p-值
F-crit
Between groups
组间方差
1,601.16
3
533.72
21.17376
1.31 x 10⁻¹⁰
2.699394
Within groups
组内方差
2,419.84
96
25.20667
Total
合计
4,021
99
Statistical software can provide hypothesis testing and give the actual value of F. If the value is below the critical F value, a value based on the accepted risk, then the null hypothesis is not rejected. Otherwise, the null hypothesis is rejected to confirm that there is a relationship between the factor and the response. Table 2 shows that the F is high, so there is a significant variation in the data. The practitioner can conclude that there is a difference in the lot means.
统计软件能够进行假设验证,并给出实际的F值。如果这个值比基于可接受的风险判定F值低,那么归无假设就不能放弃。反之,归无假设放弃就证明因子和响应之间有关系。表2显示:F值高,那么在数据中就存在显著变化。试验者能够判断出这些船运数量的均值之间的是有差异的。
Two-level Factorial Design
两水平因子设计
This is the most important design for experimentation. It is used in most experiments because it is simple, versatile and can be used for many factors. In this design, the factors are varied at two levels – low and high.
对试验来说这是最重要的设计。因为其简单、实用性强,而且适用于多因子,大多数实验都会用到两水平因子设计。。在本设计中,因子选择两个水平——低和高。
Two-level designs have many advantages. Two are:
两水平因子设计有许多优点,其中两个是:
- The size of the experiment is much smaller than other designs.
- The interactions of the factors can be detected.
For an example of a two-level factorial design, consider the cake-baking process. Three factors are studied: the brand of flour, the temperature of baking and the baking time. The associated lows and highs of these factors are listed in Table 3.
将蛋糕烘焙过程为例进行两水平因子设计,需要考察三个因子:面粉的品牌,烘焙的温度,烘焙的时间。在表3种列出了这三个因子的相关联的低和高水平情况。
Table 3: Cake-baking Factors and Their Associated Levels
表3: 蛋糕烘焙因子以及相关水平
注:面粉品牌对应的单位 Cost以为价格或费用可能会更好一点
The output responses considered are “taste” and “crust formation.” Taste was determined by a panel of experts, who rated the cake on a scale of 1 (worst) to 10 (best).The ratings were averaged and multiplied by 10. Crust formation is measured by the weight of the crust, the lower the better.
作为输出响应的是“味道”和“外皮外观”。味道由一个专家评论小组确定,他们给蛋糕从1(最坏)到10(最好)进行评级。等级为平均数乘以10。蛋糕外皮的外观由外皮的重量来标定,重量越轻越好。
The experiment design, with the responses, is shown in Table 4.
在表4中,列出了实验设计及其响应。
Table 4: Settings of Input Factors and the Resulting Responses
表4: 输入因子的设置及后果响应
注:外皮的单位应该是 克
Analysis of the results is shown in Table 5. Figures 2 through 4 show the average taste scores for each factor as it changes from low to high levels. Figures 5 through 7 are interaction plots; they show the effect of the combined manipulation of the factors.
结果分析列在表5中(见表5)。图2到图4显示出每个因子由低水平到高水平变化时的平均味道等级。图5到图7是交互作用图;它们显示出这些因子综合作用的影响。
Table 5: ANOVA Table for the Taste Response
表5: 味道响应的方差分析表
Figure 2: Average Taste Scores for Low and High Flour Brand Levels
图2: 面粉品牌水平由低到高的平均味道等级
Figure 3: Average Taste Scores for Low and High Bake Time(Minutes) Levels图3: 烘焙时间(分钟)水平由低到高的平均味道等级
Figure 4: Average Taste Scores for Low and High Baking Temperature(C) Levels图4: 烘焙温度(℃)水平由低到高的平均味道等级
Figure 5: Average Taste Scores for Flour Brand by Time(Minutes)图5: 面粉品牌和时间(分钟)交互作用下的平均味道等级
Figure 6: Average Taste Scores for Flour Brand byTemperature (C)
图6: 面粉品牌和温度(℃)交互作用下的平均味道等级
Figure 7: Average Taste Scores for Time (Minutes) byTemperature (C)
图7: 时间(分钟)和温度(℃)交互作用下的平均味道等级
From reading an F table, the critical F value at 1 percent is16.47. As the actual value of F for time and temperature exceed this value(time is at 34.306 and temperature is 23.592), it’s possible to conclude that both of them have a significant effect on the taste of the product. This is also evident from Figures 3 and 4, where the line is steep for the variation of these two factors. Figure 7 also shows that when the temperature is high, the taste sharply decreases with time (as charring takes place)
从F值表可知,在1%处F特征值为16.47。由于时间和温度的,实际F值超过这个特征值(时间为34.36,温度为23.592),很大可能断定时间和温度对产品的味道有显著的影响。这也能在图3和图4得到证据,这两个因子的方差图线是陡峭的。图7也显示出当温度高时,随着烘焙时间的增加,蛋糕的味道急剧下降(发生碳化)。
For the crust formation, the data analysis is shown in Table 6.
表6中列出了对外皮情况的数据分析
Table 6: ANOVA Table for the Crust Response
表6: 外皮响应的方差分析表
Factor
因子
df
自由度
SS
MS
F
Effect
Contrast
对比
F-crit at 1%
在1%处关键值
Brand
品牌
1
1.4
1.4
1.4938
-0.825
-3.30
16.47
Time
时间
1
1.4
1.4
1.4938
-0.825
-3.30
Brand x time
品牌x时间
1
1.1
1.1
1.1536
0.725
2.90
Temp
温度
1
0.5
0.5
0.4952
-0.475
-1.90
Brand x temp
品牌x温度
1
0.7
0.7
0.7257
0.575
2.30
Time x temp
时间x温度
1
0.1
0.1
0.0672
0.175
0.70
Brand x time x temp
品牌x时间x温度
1
0.9
0.9
1
-0.675
-2.70
Error
误差
1
0.9
0.9
Total
总计
7
5.9
In this case the actual F value for the three factors(brand, time and temperature) are below the critical F value for 1 percent(16.47 )。This shows that these are not significant factors for the crust formation in the cake. If further optimization of the crust formation is needed, then other factors, such as the quantity of ingredients in the cake(eggs, sugar and so on), should be checked.
在这个案例中,三个因子(面粉品牌,烘焙时间和烘焙温度)的实际F值均低于在1%处特征F值。这表明这些因子对蛋糕的外皮外观来说不是显著因子。如果需要进一步优化外皮外观,应该对其他的因子如蛋糕中的原料(如鸡蛋,糖等等)的质量进行验证。
Versatile Tool for Practitioners
实试验者的多功能工具
Design of experiments is a powerful tool in Six Sigma to manage the significant input factors in order to optimize the desired output. Factorial experiments are versatile because many factors can be modified and studied at once. The following resources can be helpful in learning more about DOEs:
试验设计是一个强有力的6Sigma工具,用来控制特征输入因子来优化所期望的输出。因为许多因子可以进行一次性的改动和研究,实际试验是多样的。下面的资源在更多地了解DOE时会很有帮助的:
- DOE Simplified Practical Tools for Effective Experimentation (Productivity Inc., 2000)
- Design and Analysis of Experiments (John Wiley and Sons, 1997)
About the Author: K. Sundararajan is the regional quality assurance director, greater Asia, for International Flavours and Fragrances Inc. He is a Black Belt and has been a trainer and practicing quality professional for more than 20 years. He can be reached at mailto:k.sundararajan@iff.com This e-mail address is being protected from spambots. You need JavaScript enabled to view it .
关于作者:K. Sundararajan 是International Flavours and Fragrances 公司大亚细亚区的区域品保主管。作为一个黑带,拥有超过20年质量专业的培训和实践经验。可以通过电子邮件联系他:mailto:k.sundararajan@iff.com。为了防止该邮件被处理成垃圾邮件,你需要使用JavaScript才能进行浏览。
没有找到相关结果
已邀请:


1 个回复
小编D (威望:9) (广东 广州) 互联网 员工 - 记住该记住的,忘记改忘记的。改变能改变的,接受不...
赞同来自: