
第三十一篇 Select the right statistical methods to examine data, find out
本帖最后由 小编D 于 2012-4-11 14:23 编辑
本篇文章由happyxtliu翻译, xy_persist校稿
Select the right statistical methods to examine data, find out
选择正确的统计方法来诊析数据,找出异常值(外部点)
by Robert L. Mason and John C. Young
罗伯特 L 梅森 约翰 C 杨 著
A Potential outlier is an observation located a considerable distance from the main data swarm. The inclusion of such outlying observations in a data analysis can produce erroneous estimates of means, variances and the correlations between variables.
一个潜在的外部点与其所在的数据群的位置会有明显可观测距离,数据分析时如果包含这些可观测的外部点,在评估均值、方差以及变量的关系时会得到错误的结论。
In general, this distortion increases with the distance the point is located from the main data swarm. With a single variable, an outlier will be separate from and stand out on either end of the data set. This is usually readily apparent in data plots.
通常,外部点偏离群组数据的距离越远均,对数据统计的扭曲越大。对于单一变量,外部点可能在数据的开头或结尾。这种情况通常很容易从数据曲线中直接看出。
For example, consider a set of 81 observations of bottom sulfur readings from a chemical reactor. Figure 1 is a frequency histogram of these readings. Notice that the last two intervals—composed of the two largest observations—are somewhat removed from the cluster of the remaining intervals containing the other 79 observations. The inclusion of these two large observations in the data set will inflate the sample variance and increase the size of the sample mean. A Shewhart control procedure would designate these two observations as potential outliers.
以一个化学反应器底硫量的读数为例,选取81个观测值。图1就是读数的频率直方图。注意看,最后两个区间量—最大的两个观察结果—它们与数据群的另外79个读数是分离的。如果分析时在数组中包含这两个最大值,就会使样本的方差和均值增大。按休哈特控制手法可以把这两个观测值定位可能的外部点。
Figure 1
Outliers in an industrial process become more and more difficult to detect with an increase in the dimensionality of the data. Although an outlier may not stick out on the end of the data distribution for multiple variables, they will stick out somewhere.
工业过程中随着数据维度及数据量的增加,外部点越来越难于发现。虽然异常值不一定明显的出现在多个变量数据分布的两端,但异常值也会在一些地方体现出来。
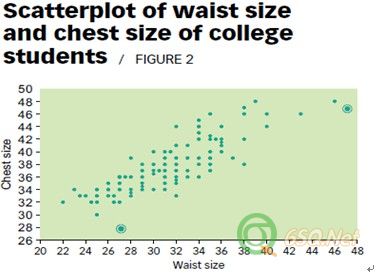
For example, consider a set of bivariate data in which the outlying observation does stick out. Figure 2 is a scatterplot of the waist size and chest size of a random sample of 147 college students. Notice there are only 80 visible points in the plot because there are multiple observations at some points.
例如,有一组双变量的数据,外部点并没有明显的表现出来,图2是随机抽取的147名大学生胸围和腰围尺寸的散点图。在散点图中看到只有80个点,有一些观测数据值是在同一个点上。
Figure 2
The two circled observations in Figure 2 are potential outliers. The first observation (27, 28) is marginally different from the others, but the second observation (47, 43) is definitely different from the others. Why does this latter observation stick out? Because it is the only observation in the data set in which the chest size of the college student is smaller than the waist size. It is interesting to note that a statistical control procedure using the T2 statistic to locate outliers designates the second observation as an outlier but does not designate the first observation as an outlier.
在图2中有两个圈注的点,就是外部点。第一个点(27,28)在观测数据组的边缘,明显与其他数据偏离,第二个点(47,43)也明显区别于其他点。为什么第二个数据与其他点不同呢?因为那个点是唯一的一个点--胸围尺寸小于腰围尺寸的。有意思的是,通过T2统计量法进行统计控制过程判定,能够判定第二个点为外部点,却不能判定第一个点。
Different ways to go
不同解决方法
The search for determining the observations that stick out in a multidimensional data set has led to the development of many different statistical procedures for outlier detection.
在多维数组中找出外部点的需求已经促成开发出多种不同的统计过程工具来进行外部点的检测。
One example is the procedure based on examining the data set in a subspace of the principal component space.1 Principal components are linear combinations of the original variables that are orthogonal to one another and are derived using either the correlation or covariance matrix of the data.
一个方法就是基于检测数据子组(数据子空间)来判定,这个子集是数据集中的重要数据。重要数据子组是取自原数据中相互垂直线性相关的变量而得到的使用相关性或协方差矩阵的数据。
The first few principal components of such data are sensitive to changes in variation and covariation of the variables, while the last few principal components are sensitive to strong collinearities in the data. Reducing the dimensionality of the data by using only the first two or three principal components often allows an analyst to visibly locate outliers in principal component plots, which contributes to variation problems.
这些数据首要几个要素是对于变量的变动或关联变动敏感,而另外的要素是成强线性相关的数据。用前两种或第三种要素来减少数组维度,我们通常允许分析员在主要数据图上清晰的标出外部点,这些外部点可能带来波动问题。
Another popular outlier detection procedure is based on using a control chart of the T2 statistic and designating points with T2 values outside the control limits as outliers.2 When the sample data contain clusters of outliers, however, this statistic is subject to masking and swamping problems. Clustering outlier observations on the fringe of a data swarm is the main cause of problems called swamping and masking.
另外一个常用的外部点检测流程是使用T2统计分析的控制图和采用T2值来定义外部点的控制线。如果数据样本中有成群的外部点,那么这种统计方法就会掩盖问题不能正确识别出外部点。分布在数据组边缘的成群外部点是造成掩盖真相的主要原因,这种问题被称作异常点一般在统计群组数据的边缘,这样的异常点叫做“覆盖”或“掩蔽”。
Swamping occurs when the cluster pulls the data swarm toward it. In doing so, non-outlying observations on the fringe, opposite the cluster, will appear farther from the data swarm and be designated as potential outliers. Masking occurs when the cluster of outliers pulls the data swamp toward it and inflates the estimates of the mean and covariance parameters in the directions of the cluster so individual observations within the cluster do not show up as outliers.
“Swamping覆盖”现象会将整组数据拉向比较靠近它的一侧,如何这样的话,位于外部点群异侧的数组边缘的非外部点就会远离数据组而被定义为潜在的外部点。“Masking掩蔽”现象也会拉动数据向靠近它的方向分布,这在对整组数据进行评估时会往外部点组的方向增大均值和参数的协方差,这样这部分单独的点群就不会显示出外部点的特征。
Some of the more recent procedures for detecting multivariate outliers include those based on the use of robust estimators. Such outlier detection schemes are not subject to the masking and swamping problems that can plague methods based on common estimators.
还有一些最近检测多变量数组中外部点的方法还有基于完全评估的方法。这些异常点检测方法设计不适用“Swamping覆盖效应”和“Masking掩蔽效应”数据(能对普通数据统计造成大问题)
And outliers do not have the same ill effects on the robust estimators as they do on the common estimators. Robust estimates of the variances, means and correlations of the related variables, however, may be far removed from the true values of these statistics. In addition, many of these procedures are limited from practical use because they can be computationally intense.
在运用完全评估(或稳健估计)时,外部点不会出现与一般评估过程中出现的不良影响。然而相关变量的方差、平均值和相关性可能会远离这些统计量的真值。另外,这些过程在实践中都会有其局限性,由于这都是估算的。
Better detection schemes
更好的检测方案
A preliminary step that would improve these outlier detection schemes is to follow the procedure recommended when creating a multivariate statistical control procedure for an industrial process.3
当在工业过程中创建一个多变量统计控制流程时,首先要根据推荐的流程来改善外部点的检测方案。
In a preliminary data analysis (that is, a phase I analysis) of such a procedure, a set of data is obtained under good operational conditions as judged by the process engineer. The data set then is subjected to a detailed data analysis from numerous perspectives. Charts, graphs and plots are used to locate unusual patterns and clusters in the data set. When these occur, irregularities are investigated for cause. This type of detailed data analysis will remove many of the outliers and data abnormalities that could be difficult for classical statistical procedures to detect.
在这样的流程中进行原始数据分析(第一步分析)时,得到的数据都是在良好的操作状态下并经过工艺工程师判定的点。这些数据被从不同的多个方面进行详细分析。通过图表分析,图形分析,曲线分析等方式来区分数据组中出现异常的点或点群。这种情况出现时就能根据不规律性来判定发生异常的原因。这种详细数据的分析方法,可以找出很多在常规统计过程中难于发现的外部点和异常值。
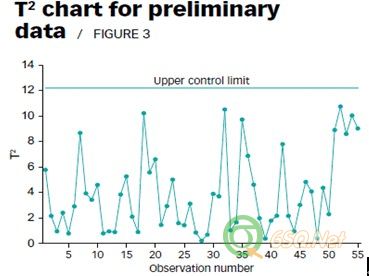
To illustrate this approach, consider a preliminary data set consisting of 55 observations on four variables. Suppose no detailed data analysis has been performed to search for data abnormalities. With a = 0.01, we use the T2 statistic based on the common estimates of the mean vector and covariance matrix to scan for potential outliers. Figure 3 shows the T2 control chart.
为了阐明这种方法,考虑一个由4个参数变量构成的有55个观测值的数据组。假设没有对数据进行详细分析,进而找出异常值。我们使用T2统计法,在置信度a = 0.01条件下基于一般评估的平均适量和协方差矩阵来检测潜在的外部点,图3所示为T2控制图
Figure 3
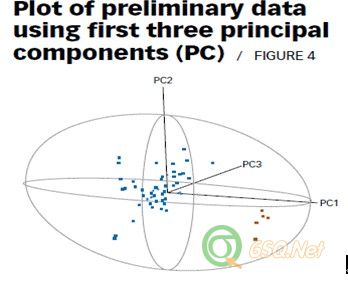
Because none of the T2 values signal in the chart in Figure 3, you might conclude that no outliers are present in the data. If we had plotted the data using the first three principal components of the correlation matrix and scanned the resulting plot, however, a completely different conclusion would result. The first three principal components explain more than 98% of the total variation present in this data set. A principal component plot for these three components is shown in Figure 4. The data swarm is enclosed in a 99% ellipsoid that corresponds to a = 0.01 and is equivalent to the T2 chart in Figure 3.
由于在图3的T2控制图中没外部点出现,人们可能会得出数组中没有异常值的结论。但是,如果我们使用相关矩阵中的前序三要素检测结果曲线时,一个完全不同的结果会呈现出来。前序三要素能够解释该数组中98%以上的总变差。图4所示为三要素的数据统计分析图。,观测数据组据集在99%的椭圆内,置信度a = 0.01,相当于图3的T2统计图。
Figure 4
Although no observation is outside the T2 ellipsoid in Figure 4, two different data clusters are clearly evident in the plot. The larger cluster (the blue points) consists of the first 50 observations plotted in theT2 chart in Figure 3. The smaller cluster (the red points) contains the last five observations located on theT2 chart. The outlying observations in the smaller cluster were added to an original data set of 50 observations (with no outliers) to illustrate how a cluster of outliers can mask the performance of the T2statistic. A detailed data analysis based on use of the principal component plot in Figure 4 would have helped the analyst quickly spot this cluster of potential outliers.
在图4中,虽然在T2椭圆外部没有观测点,但是在曲线上有两组数据明显的区分开来。其中一个大的数据群(蓝色的那些点)由图3中T2控制图里的前50个数据构成,另外一个小的数据群(红色的点)由图3中T2控制图里后面的5点构成。如果把这个观测到的边缘小数据群,加入到无异常值的大数据群(50个观测值)后,这就解释了在T2统计中一个外部点数据群是如何发生掩蔽的。 如图4所示,基于重要影响因素的详细的数据分析,能够帮助分析人员迅速的找出可能的外部点群。
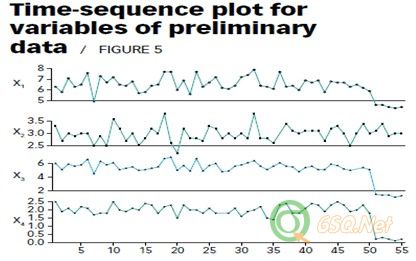
These five observations would also have been detected as potential outliers if a time-sequence plot of each of the four variables had been examined. These plots are shown in Figure 5. Notice the last five observations for variables x1, x3 and x4 all have much lower values than the rest of the observations on each variable. These three variables are the ones that dominate the first three principal components. In contrast, the last five observations on variable x2 do not show any such change from the rest of the observations. This variable loads the heaviest on the fourth principal component, which has little influence on the results.
如果对四个变量分别绘制时间序列曲线,上述5个观测值也能作为潜在的外部点被检出。这些顺序图如图5所示。注意看,参数变量x1,、 x3和 x4的时间序列图中,最后的5个数值都明显的低于前面的数值。这三个参数变量在前面所说的三个重要影响因素(参数)起主导作用。与此相对的,变量x2最后5个值没有发生明显偏离变化,它在重要数据变量中起第四位的作用,对整个评估结果影响不大。
Figure 5
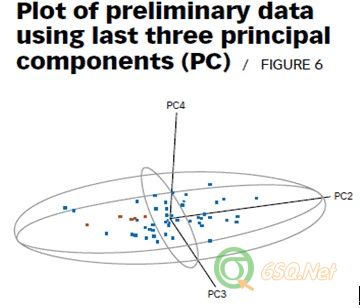
If you examine a plot of the data of the last three principal components, there is no evidence of the separation of the small cluster of outliers. This is shown in Figure 6. Notice the 50 observations (the blue points) in the large cluster now overlap with the five observations (the red points) in the small cluster.
如果你查看数据时按照最后三个重要影响参数,则不会发现分离的外部点。在图6中可以看到,50个观测值(蓝色的点)在一个大的区域中,并覆盖了那5个小区域的观测值(红色的点)。
Figure 6
Recall that plots of the first few principal components are most sensitive to changes in the variation and covariation among the variables. The data separation seen in the principal component plot in Figure 4 is caused by the influence of the five outliers associated with variables x1, x3 and x4 on the overall variation based on the first principal component. As shown in Figure 6, these outliers do not have such an effect on the overall variation based on the last three principal components.
回顾以上,可以得到这样的结论,靠前的重要影响因素(变量)对于变量及变量相互之间的变化是非常敏感的。在图4中看到的,在重要影响因素图中分离出来的5个异常数据与x1,、 x3 和 x4相关,即他们的变化基于重要影响因素。然而在图6中基于逆序排列的重要影响因素,却不能看到这些外部点对整个变动的影响。
________________________________________
Robert L. Mason is an institute analyst at Southwest Research Institute in San Antonio, TX. He has a doctorate in statistics from Southern Methodist University in Dallas and is a fellow of ASQ and the American Statistical Association.
罗伯特 L 梅森 在圣安东尼奥的西南研究所的研究员。他获得达拉斯州南卫理公会大学统计学博士学位,并且是美国质量管理协会,美国统计协会的成员
John C. Young is a retired professor of statistics from McNeese State University in Lake Charles, LA. He received a doctorate in statistics from Southern Methodist University.
约翰 C 杨 是路易斯安那 麦克尼斯州立大学统计学专业的退休教授。他是南卫理公会大学的统计学博士。

本篇文章由happyxtliu翻译, xy_persist校稿
Select the right statistical methods to examine data, find out
选择正确的统计方法来诊析数据,找出异常值(外部点)
by Robert L. Mason and John C. Young
罗伯特 L 梅森 约翰 C 杨 著
A Potential outlier is an observation located a considerable distance from the main data swarm. The inclusion of such outlying observations in a data analysis can produce erroneous estimates of means, variances and the correlations between variables.
一个潜在的外部点与其所在的数据群的位置会有明显可观测距离,数据分析时如果包含这些可观测的外部点,在评估均值、方差以及变量的关系时会得到错误的结论。
In general, this distortion increases with the distance the point is located from the main data swarm. With a single variable, an outlier will be separate from and stand out on either end of the data set. This is usually readily apparent in data plots.
通常,外部点偏离群组数据的距离越远均,对数据统计的扭曲越大。对于单一变量,外部点可能在数据的开头或结尾。这种情况通常很容易从数据曲线中直接看出。
For example, consider a set of 81 observations of bottom sulfur readings from a chemical reactor. Figure 1 is a frequency histogram of these readings. Notice that the last two intervals—composed of the two largest observations—are somewhat removed from the cluster of the remaining intervals containing the other 79 observations. The inclusion of these two large observations in the data set will inflate the sample variance and increase the size of the sample mean. A Shewhart control procedure would designate these two observations as potential outliers.
以一个化学反应器底硫量的读数为例,选取81个观测值。图1就是读数的频率直方图。注意看,最后两个区间量—最大的两个观察结果—它们与数据群的另外79个读数是分离的。如果分析时在数组中包含这两个最大值,就会使样本的方差和均值增大。按休哈特控制手法可以把这两个观测值定位可能的外部点。
Figure 1
Outliers in an industrial process become more and more difficult to detect with an increase in the dimensionality of the data. Although an outlier may not stick out on the end of the data distribution for multiple variables, they will stick out somewhere.
工业过程中随着数据维度及数据量的增加,外部点越来越难于发现。虽然异常值不一定明显的出现在多个变量数据分布的两端,但异常值也会在一些地方体现出来。
For example, consider a set of bivariate data in which the outlying observation does stick out. Figure 2 is a scatterplot of the waist size and chest size of a random sample of 147 college students. Notice there are only 80 visible points in the plot because there are multiple observations at some points.
例如,有一组双变量的数据,外部点并没有明显的表现出来,图2是随机抽取的147名大学生胸围和腰围尺寸的散点图。在散点图中看到只有80个点,有一些观测数据值是在同一个点上。
Figure 2
The two circled observations in Figure 2 are potential outliers. The first observation (27, 28) is marginally different from the others, but the second observation (47, 43) is definitely different from the others. Why does this latter observation stick out? Because it is the only observation in the data set in which the chest size of the college student is smaller than the waist size. It is interesting to note that a statistical control procedure using the T2 statistic to locate outliers designates the second observation as an outlier but does not designate the first observation as an outlier.
在图2中有两个圈注的点,就是外部点。第一个点(27,28)在观测数据组的边缘,明显与其他数据偏离,第二个点(47,43)也明显区别于其他点。为什么第二个数据与其他点不同呢?因为那个点是唯一的一个点--胸围尺寸小于腰围尺寸的。有意思的是,通过T2统计量法进行统计控制过程判定,能够判定第二个点为外部点,却不能判定第一个点。
Different ways to go
不同解决方法
The search for determining the observations that stick out in a multidimensional data set has led to the development of many different statistical procedures for outlier detection.
在多维数组中找出外部点的需求已经促成开发出多种不同的统计过程工具来进行外部点的检测。
One example is the procedure based on examining the data set in a subspace of the principal component space.1 Principal components are linear combinations of the original variables that are orthogonal to one another and are derived using either the correlation or covariance matrix of the data.
一个方法就是基于检测数据子组(数据子空间)来判定,这个子集是数据集中的重要数据。重要数据子组是取自原数据中相互垂直线性相关的变量而得到的使用相关性或协方差矩阵的数据。
The first few principal components of such data are sensitive to changes in variation and covariation of the variables, while the last few principal components are sensitive to strong collinearities in the data. Reducing the dimensionality of the data by using only the first two or three principal components often allows an analyst to visibly locate outliers in principal component plots, which contributes to variation problems.
这些数据首要几个要素是对于变量的变动或关联变动敏感,而另外的要素是成强线性相关的数据。用前两种或第三种要素来减少数组维度,我们通常允许分析员在主要数据图上清晰的标出外部点,这些外部点可能带来波动问题。
Another popular outlier detection procedure is based on using a control chart of the T2 statistic and designating points with T2 values outside the control limits as outliers.2 When the sample data contain clusters of outliers, however, this statistic is subject to masking and swamping problems. Clustering outlier observations on the fringe of a data swarm is the main cause of problems called swamping and masking.
另外一个常用的外部点检测流程是使用T2统计分析的控制图和采用T2值来定义外部点的控制线。如果数据样本中有成群的外部点,那么这种统计方法就会掩盖问题不能正确识别出外部点。分布在数据组边缘的成群外部点是造成掩盖真相的主要原因,这种问题被称作异常点一般在统计群组数据的边缘,这样的异常点叫做“覆盖”或“掩蔽”。
Swamping occurs when the cluster pulls the data swarm toward it. In doing so, non-outlying observations on the fringe, opposite the cluster, will appear farther from the data swarm and be designated as potential outliers. Masking occurs when the cluster of outliers pulls the data swamp toward it and inflates the estimates of the mean and covariance parameters in the directions of the cluster so individual observations within the cluster do not show up as outliers.
“Swamping覆盖”现象会将整组数据拉向比较靠近它的一侧,如何这样的话,位于外部点群异侧的数组边缘的非外部点就会远离数据组而被定义为潜在的外部点。“Masking掩蔽”现象也会拉动数据向靠近它的方向分布,这在对整组数据进行评估时会往外部点组的方向增大均值和参数的协方差,这样这部分单独的点群就不会显示出外部点的特征。
Some of the more recent procedures for detecting multivariate outliers include those based on the use of robust estimators. Such outlier detection schemes are not subject to the masking and swamping problems that can plague methods based on common estimators.
还有一些最近检测多变量数组中外部点的方法还有基于完全评估的方法。这些异常点检测方法设计不适用“Swamping覆盖效应”和“Masking掩蔽效应”数据(能对普通数据统计造成大问题)
And outliers do not have the same ill effects on the robust estimators as they do on the common estimators. Robust estimates of the variances, means and correlations of the related variables, however, may be far removed from the true values of these statistics. In addition, many of these procedures are limited from practical use because they can be computationally intense.
在运用完全评估(或稳健估计)时,外部点不会出现与一般评估过程中出现的不良影响。然而相关变量的方差、平均值和相关性可能会远离这些统计量的真值。另外,这些过程在实践中都会有其局限性,由于这都是估算的。
Better detection schemes
更好的检测方案
A preliminary step that would improve these outlier detection schemes is to follow the procedure recommended when creating a multivariate statistical control procedure for an industrial process.3
当在工业过程中创建一个多变量统计控制流程时,首先要根据推荐的流程来改善外部点的检测方案。
In a preliminary data analysis (that is, a phase I analysis) of such a procedure, a set of data is obtained under good operational conditions as judged by the process engineer. The data set then is subjected to a detailed data analysis from numerous perspectives. Charts, graphs and plots are used to locate unusual patterns and clusters in the data set. When these occur, irregularities are investigated for cause. This type of detailed data analysis will remove many of the outliers and data abnormalities that could be difficult for classical statistical procedures to detect.
在这样的流程中进行原始数据分析(第一步分析)时,得到的数据都是在良好的操作状态下并经过工艺工程师判定的点。这些数据被从不同的多个方面进行详细分析。通过图表分析,图形分析,曲线分析等方式来区分数据组中出现异常的点或点群。这种情况出现时就能根据不规律性来判定发生异常的原因。这种详细数据的分析方法,可以找出很多在常规统计过程中难于发现的外部点和异常值。
To illustrate this approach, consider a preliminary data set consisting of 55 observations on four variables. Suppose no detailed data analysis has been performed to search for data abnormalities. With a = 0.01, we use the T2 statistic based on the common estimates of the mean vector and covariance matrix to scan for potential outliers. Figure 3 shows the T2 control chart.
为了阐明这种方法,考虑一个由4个参数变量构成的有55个观测值的数据组。假设没有对数据进行详细分析,进而找出异常值。我们使用T2统计法,在置信度a = 0.01条件下基于一般评估的平均适量和协方差矩阵来检测潜在的外部点,图3所示为T2控制图
Figure 3
Because none of the T2 values signal in the chart in Figure 3, you might conclude that no outliers are present in the data. If we had plotted the data using the first three principal components of the correlation matrix and scanned the resulting plot, however, a completely different conclusion would result. The first three principal components explain more than 98% of the total variation present in this data set. A principal component plot for these three components is shown in Figure 4. The data swarm is enclosed in a 99% ellipsoid that corresponds to a = 0.01 and is equivalent to the T2 chart in Figure 3.
由于在图3的T2控制图中没外部点出现,人们可能会得出数组中没有异常值的结论。但是,如果我们使用相关矩阵中的前序三要素检测结果曲线时,一个完全不同的结果会呈现出来。前序三要素能够解释该数组中98%以上的总变差。图4所示为三要素的数据统计分析图。,观测数据组据集在99%的椭圆内,置信度a = 0.01,相当于图3的T2统计图。
Figure 4
Although no observation is outside the T2 ellipsoid in Figure 4, two different data clusters are clearly evident in the plot. The larger cluster (the blue points) consists of the first 50 observations plotted in theT2 chart in Figure 3. The smaller cluster (the red points) contains the last five observations located on theT2 chart. The outlying observations in the smaller cluster were added to an original data set of 50 observations (with no outliers) to illustrate how a cluster of outliers can mask the performance of the T2statistic. A detailed data analysis based on use of the principal component plot in Figure 4 would have helped the analyst quickly spot this cluster of potential outliers.
在图4中,虽然在T2椭圆外部没有观测点,但是在曲线上有两组数据明显的区分开来。其中一个大的数据群(蓝色的那些点)由图3中T2控制图里的前50个数据构成,另外一个小的数据群(红色的点)由图3中T2控制图里后面的5点构成。如果把这个观测到的边缘小数据群,加入到无异常值的大数据群(50个观测值)后,这就解释了在T2统计中一个外部点数据群是如何发生掩蔽的。 如图4所示,基于重要影响因素的详细的数据分析,能够帮助分析人员迅速的找出可能的外部点群。
These five observations would also have been detected as potential outliers if a time-sequence plot of each of the four variables had been examined. These plots are shown in Figure 5. Notice the last five observations for variables x1, x3 and x4 all have much lower values than the rest of the observations on each variable. These three variables are the ones that dominate the first three principal components. In contrast, the last five observations on variable x2 do not show any such change from the rest of the observations. This variable loads the heaviest on the fourth principal component, which has little influence on the results.
如果对四个变量分别绘制时间序列曲线,上述5个观测值也能作为潜在的外部点被检出。这些顺序图如图5所示。注意看,参数变量x1,、 x3和 x4的时间序列图中,最后的5个数值都明显的低于前面的数值。这三个参数变量在前面所说的三个重要影响因素(参数)起主导作用。与此相对的,变量x2最后5个值没有发生明显偏离变化,它在重要数据变量中起第四位的作用,对整个评估结果影响不大。
Figure 5
If you examine a plot of the data of the last three principal components, there is no evidence of the separation of the small cluster of outliers. This is shown in Figure 6. Notice the 50 observations (the blue points) in the large cluster now overlap with the five observations (the red points) in the small cluster.
如果你查看数据时按照最后三个重要影响参数,则不会发现分离的外部点。在图6中可以看到,50个观测值(蓝色的点)在一个大的区域中,并覆盖了那5个小区域的观测值(红色的点)。
Figure 6
Recall that plots of the first few principal components are most sensitive to changes in the variation and covariation among the variables. The data separation seen in the principal component plot in Figure 4 is caused by the influence of the five outliers associated with variables x1, x3 and x4 on the overall variation based on the first principal component. As shown in Figure 6, these outliers do not have such an effect on the overall variation based on the last three principal components.
回顾以上,可以得到这样的结论,靠前的重要影响因素(变量)对于变量及变量相互之间的变化是非常敏感的。在图4中看到的,在重要影响因素图中分离出来的5个异常数据与x1,、 x3 和 x4相关,即他们的变化基于重要影响因素。然而在图6中基于逆序排列的重要影响因素,却不能看到这些外部点对整个变动的影响。
________________________________________
Robert L. Mason is an institute analyst at Southwest Research Institute in San Antonio, TX. He has a doctorate in statistics from Southern Methodist University in Dallas and is a fellow of ASQ and the American Statistical Association.
罗伯特 L 梅森 在圣安东尼奥的西南研究所的研究员。他获得达拉斯州南卫理公会大学统计学博士学位,并且是美国质量管理协会,美国统计协会的成员
John C. Young is a retired professor of statistics from McNeese State University in Lake Charles, LA. He received a doctorate in statistics from Southern Methodist University.
约翰 C 杨 是路易斯安那 麦克尼斯州立大学统计学专业的退休教授。他是南卫理公会大学的统计学博士。
没有找到相关结果
已邀请:


2 个回复
小编H (威望:4) (广东 广州) 互联网 员工
赞同来自: