
【翻译】第二十篇 Design of Experiments – A Primer
本帖最后由 小编D 于 2011-12-16 14:15 编辑 _
你好,我是小编H。请对以下文章有翻译兴趣的组员留下你的预计完成时间,并发短信息联系小编H,以便小编登记翻译者信息以及文章最终完成时的奖惩工作。
原文有大量图表,请翻译者务必联系小编,以便把原文文档发到翻译者邮箱~~~
Design of Experiments – A Primer
Understanding the terms and concepts that are part of a DOE can help practitioners be better prepared to use the statistical tool.By K. SundararajanDesign of experiments (DOE) is a systematic method to determine the relationship between factors affecting a process and the output of that process. In other words, it is used to find cause-and-effect relationships. This information is needed to manage process inputs in order to optimize the output.An understanding of DOE first requires knowledge of some statistical tools and experimentation concepts. Although a DOE can be analyzed in many software programs, it is important for practitioners to understand basic DOE concepts for proper application.Common DOE Terms and ConceptsThe most commonly used terms in the DOE methodology include: controllable and uncontrollable input factors, responses, hypothesis testing, blocking, replication and interaction. · _Controllable input factors_, or _x_ factors, are those input parameters that can be modified in an experiment or process. For example, in cooking rice, these factors include the quantity and quality of the rice and the quantity of water used for boiling.· _Uncontrollable input factors_ are those parameters that cannot be changed. In the rice-cooking example, this may be the temperature in the kitchen. These factors need to be recognized to understand how they may affect the response.· _Responses_, or output measures, are the elements of the process outcome that gage the desired effect. In the cooking example, the taste and texture of the rice are the responses.The controllable input factors can be modified to optimize the output. The relationship between the factors and responses is shown in Figure 1.Figure 1: Process Factors and Responses
· _Hypothesis testing_ helps determine the significant factors using statistical methods. There are two possibilities in a hypothesis statement: the null and the alternative. The null hypothesis is valid if the status quo is true. The alternative hypothesis is true if the status quo is not valid. Testing is done at a level of significance, which is based on a probability.· _Blocking and replication_: _Blocking_ is an experimental technique to avoid any unwanted variations in the input or experimental process. For example, an experiment may be conducted with the same equipment to avoid any equipment variations. Practitioners also _replicate_ experiments, performing the same combination run more than once, in order to get an estimate for the amount of random error that could be part of the process.· _Interaction:_ When an experiment has three or more variables, an _interaction_ is a situation in which the simultaneous influence of two variables on a third is not additive.A Simple One-factor ExperimentThe comparison of two or more levels in a factor can be done using an F-test. This compares the variance of the means of different factor levels with the individual variances, using this equation:_F = ns2Y-bar / s2pooled_where:
_n_ = the sample size
s2Y-bar = the variance of the means, which is calculated by dividing the sum of variances of the individual means by the degrees of freedom
_s2pooled_ = pooled variance, or the average of the individual variancesThis is similar to the signal-to-noise ratio used in electronics. If the value of F (the test statistic) is greater than the F-critical value, it means there is a significant difference between the levels, or one level is giving a response that is different from the others. Caution is also needed to ensure that _s2pooled_ is kept to a minimum, as it is the noise or error term. If the F value is high, the probability (_p_-value) will fall below 0.05, indicating that there is a significant difference between levels. The value of 0.05 is a typical accepted risk value. If F = 1, it means the factor has no effect.As an example of a one-factor experiment, data from an incoming shipment of a product is given in Table 1.Table 1: Incoming Shipment Data
Lot
Data
A
61, 61, 57, 56, 60, 52, 62, 59, 62, 67, 55, 56, 52, 60, 59, 59, 60, 59, 49, 42, 55, 67, 53, 66, 60
B
56, 56, 61, 67, 58, 63, 56, 60, 55, 46, 62, 65, 63, 59, 60, 60, 59, 60, 65, 65, 62, 51, 62, 52, 58
C
62, 62, 72, 63, 51, 65, 62, 59, 62, 63, 68, 64, 67, 60, 59, 59, 61, 58, 65, 64, 70, 63, 68, 62, 61
D
70, 70, 50, 68, 71, 65, 70, 73, 70, 69, 64, 68, 65, 72, 73, 75, 72, 75, 64, 69, 60, 68, 66, 69, 72
When a practitioner completes an analysis of variance (ANOVA), the following results are obtained:Table 2: ANOVA Summary
Groups
Count
Sum
Average
Variance
A
25
1,449
57.96
31.54
B
25
1,483
59.32
23.14333
C
25
1,570
62.80
18.5
D
25
1,708
68.32
27.64333
ANOVA
Source of Variation
SS
df
MS
F
p-value
F-crit
Between groups
1,601.16
3
533.72
21.17376
1.31 x 10⁻¹⁰
2.699394
Within groups
2,419.84
96
25.20667
Total
4,021
99
Statistical software can provide hypothesis testing and give the actual value of F. If the value is below the critical F value, a value based on the accepted risk, then the null hypothesis is not rejected. Otherwise, the null hypothesis is rejected to confirm that there is a relationship between the factor and the response. Table 2 shows that the F is high, so there is a significant variation in the data. The practitioner can conclude that there is a difference in the lot means.Two-level Factorial DesignThis is the most important design for experimentation. It is used in most experiments because it is simple, versatile and can be used for many factors. In this design, the factors are varied at two levels – low and high.Two-level designs have many advantages. Two are:1. The size of the experiment is much smaller than other designs.2. The interactions of the factors can be detected.For an example of a two-level factorial design, consider the cake-baking process. Three factors are studied: the brand of flour, the temperature of baking and the baking time. The associated lows and highs of these factors are listed in Table 3.Table 3: Cake-baking Factors and Their Associated Levels
Factor
Name
Units
Low Level (-)
High Level (+)
A
Flour brand
Cost
Cheap
Costly
B
Time
Minutes
10
15
C
Temperature
Degrees (C)
70
80
The output responses considered are “taste” and “crust formation.” Taste was determined by a panel of experts, who rated the cake on a scale of 1 (worst) to 10 (best). The ratings were averaged and multiplied by 10. Crust formation is measured by the weight of the crust, the lower the better.The experiment design, with the responses, is shown in Table 4.Table 4: Settings of Input Factors and the Resulting Responses
Run Order
A: Brand
B: Time (min)
C: Temp. (C)
_Y1_: Taste (rating)
_Y2_: Crust (grams)
1
Costly(+)
10(-)
70(-)
75
0.3
2
Cheap(-)
15(+)
70(-)
71
0.7
3
Cheap(-)
10(-)
80(+)
81
1.2
4
Costly(+)
15(+)
70(-)
80
0.7
5
Costly(+)
10(-)
80(+)
77
0.9
6
Costly(+)
15(+)
80(+)
32
0.3
7
Cheap(-)
15(+)
80(+)
42
0.5
8
Cheap(-)
10(-)
70(-)
74
3.1
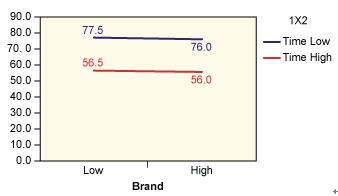
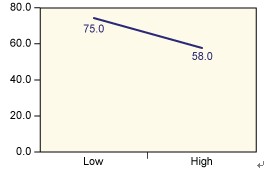
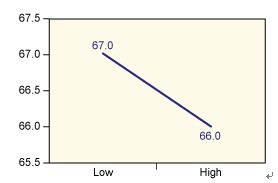
Analysis of the results is shown in Table 5. Figures 2 through 4 show the average taste scores for each factor as it changes from low to high levels. Figures 5 through 7 are interaction plots; they show the effect of the combined manipulation of the factors. Table 5: ANOVA Table for the Taste Response
Factor
df
SS
MS
F
Effect
Contrast
p
F-crit at 1%
Brand
1
2.0
2.0
0.0816
-1
-4.00
0.82
16.47
Time
1
840.5
840.5
34.306
-20.5
-82.00
0.11
Brand x time
1
0.5
0.5
0.0204
0.5
2.00
0.91
Temp
1
578.0
578.0
23.592
-17
-68.00
0.13
Brand x temp
1
72.0
72.0
2.9388
-6
-24.00
0.34
Time x temp
1
924.5
924.5
37.735
-21.5
-86.00
0.10
Brand x time x temp
1
24.5
24.5
1
-3.5
-14.00
0.50
Error
1
24.5
24.5
Total
7
2442.0
Figure 2: Average Taste Scores for Low and High Flour Brand LevelsFigure 3: Average Taste Scores for Low and High Bake Time (Minutes) LevelsFigure 4: Average Taste Scores for Low and High Baking Temperature (C) LevelsFigure 5: Average Taste Scores for Flour Brand by Time (Minutes)Figure 6: Average Taste Scores for Flour Brand by Temperature (C)Figure 7: Average Taste Scores for Time (Minutes) by Temperature (C)From reading an http://faculty.vassar.edu/lowry/PDF/Ftable.pdf, the critical F value at 1 percent is 16.47. As the actual value of F for time and temperature exceed this value (time is at 34.306 and temperature is 23.592), it’s possible to conclude that both of them have a significant effect on the taste of the product. This is also evident from Figures 3 and 4, where the line is steep for the variation of these two factors. Figure 7 also shows that when the temperature is high, the taste sharply decreases with time (as charring takes place).For the crust formation, the data analysis is shown in Table 6.Table 6: ANOVA Table for the Crust Response
Factor
df
SS
MS
F
Effect
Contrast
F-crit at 1%
Brand
1
1.4
1.4
1.4938
-0.825
-3.30
16.47
Time
1
1.4
1.4
1.4938
-0.825
-3.30
Brand x time
1
1.1
1.1
1.1536
0.725
2.90
Temp
1
0.5
0.5
0.4952
-0.475
-1.90
Brand x temp
1
0.7
0.7
0.7257
0.575
2.30
Time x temp
1
0.1
0.1
0.0672
0.175
0.70
Brand x time x temp
1
0.9
0.9
1
-0.675
-2.70
Error
1
0.9
0.9
Total
7
5.9
In this case the actual F value for the three factors (brand, time and temperature) are below the critical F value for 1 percent (16.47). This shows that these are not significant factors for the crust formation in the cake. If further optimization of the crust formation is needed, then other factors, such as the quantity of ingredients in the cake (eggs, sugar and so on), should be checked.Versatile Tool for PractitionersDesign of experiments is a powerful tool in Six Sigma to manage the significant input factors in order to optimize the desired output. Factorial experiments are versatile because many factors can be modified and studied at once. The following resources can be helpful in learning more about DOEs:1. _DOE Simplified Practical Tools for Effective Experimentation_ (Productivity Inc., 2000)2. _Design and Analysis of Experiments_ (John Wiley and Sons, 1997)About the Author: _K. Sundararajan__ is the regional quality assurance director, greater Asia, for International Flavours and Fragrances Inc. He is a Black Belt and has been a trainer and practicing quality professional for more than 20 years. He can be reached at __mailto:k.sundararajan@iff.com __This e-mail address is being protected from spambots. You need JavaScript enabled to view it __._


你好,我是小编H。请对以下文章有翻译兴趣的组员留下你的预计完成时间,并发短信息联系小编H,以便小编登记翻译者信息以及文章最终完成时的奖惩工作。
原文有大量图表,请翻译者务必联系小编,以便把原文文档发到翻译者邮箱~~~
Design of Experiments – A Primer
Understanding the terms and concepts that are part of a DOE can help practitioners be better prepared to use the statistical tool.By K. SundararajanDesign of experiments (DOE) is a systematic method to determine the relationship between factors affecting a process and the output of that process. In other words, it is used to find cause-and-effect relationships. This information is needed to manage process inputs in order to optimize the output.An understanding of DOE first requires knowledge of some statistical tools and experimentation concepts. Although a DOE can be analyzed in many software programs, it is important for practitioners to understand basic DOE concepts for proper application.Common DOE Terms and ConceptsThe most commonly used terms in the DOE methodology include: controllable and uncontrollable input factors, responses, hypothesis testing, blocking, replication and interaction. · _Controllable input factors_, or _x_ factors, are those input parameters that can be modified in an experiment or process. For example, in cooking rice, these factors include the quantity and quality of the rice and the quantity of water used for boiling.· _Uncontrollable input factors_ are those parameters that cannot be changed. In the rice-cooking example, this may be the temperature in the kitchen. These factors need to be recognized to understand how they may affect the response.· _Responses_, or output measures, are the elements of the process outcome that gage the desired effect. In the cooking example, the taste and texture of the rice are the responses.The controllable input factors can be modified to optimize the output. The relationship between the factors and responses is shown in Figure 1.Figure 1: Process Factors and Responses
· _Hypothesis testing_ helps determine the significant factors using statistical methods. There are two possibilities in a hypothesis statement: the null and the alternative. The null hypothesis is valid if the status quo is true. The alternative hypothesis is true if the status quo is not valid. Testing is done at a level of significance, which is based on a probability.· _Blocking and replication_: _Blocking_ is an experimental technique to avoid any unwanted variations in the input or experimental process. For example, an experiment may be conducted with the same equipment to avoid any equipment variations. Practitioners also _replicate_ experiments, performing the same combination run more than once, in order to get an estimate for the amount of random error that could be part of the process.· _Interaction:_ When an experiment has three or more variables, an _interaction_ is a situation in which the simultaneous influence of two variables on a third is not additive.A Simple One-factor ExperimentThe comparison of two or more levels in a factor can be done using an F-test. This compares the variance of the means of different factor levels with the individual variances, using this equation:_F = ns2Y-bar / s2pooled_where:
_n_ = the sample size
s2Y-bar = the variance of the means, which is calculated by dividing the sum of variances of the individual means by the degrees of freedom
_s2pooled_ = pooled variance, or the average of the individual variancesThis is similar to the signal-to-noise ratio used in electronics. If the value of F (the test statistic) is greater than the F-critical value, it means there is a significant difference between the levels, or one level is giving a response that is different from the others. Caution is also needed to ensure that _s2pooled_ is kept to a minimum, as it is the noise or error term. If the F value is high, the probability (_p_-value) will fall below 0.05, indicating that there is a significant difference between levels. The value of 0.05 is a typical accepted risk value. If F = 1, it means the factor has no effect.As an example of a one-factor experiment, data from an incoming shipment of a product is given in Table 1.Table 1: Incoming Shipment Data
Lot
Data
A
61, 61, 57, 56, 60, 52, 62, 59, 62, 67, 55, 56, 52, 60, 59, 59, 60, 59, 49, 42, 55, 67, 53, 66, 60
B
56, 56, 61, 67, 58, 63, 56, 60, 55, 46, 62, 65, 63, 59, 60, 60, 59, 60, 65, 65, 62, 51, 62, 52, 58
C
62, 62, 72, 63, 51, 65, 62, 59, 62, 63, 68, 64, 67, 60, 59, 59, 61, 58, 65, 64, 70, 63, 68, 62, 61
D
70, 70, 50, 68, 71, 65, 70, 73, 70, 69, 64, 68, 65, 72, 73, 75, 72, 75, 64, 69, 60, 68, 66, 69, 72
When a practitioner completes an analysis of variance (ANOVA), the following results are obtained:Table 2: ANOVA Summary
Groups
Count
Sum
Average
Variance
A
25
1,449
57.96
31.54
B
25
1,483
59.32
23.14333
C
25
1,570
62.80
18.5
D
25
1,708
68.32
27.64333
ANOVA
Source of Variation
SS
df
MS
F
p-value
F-crit
Between groups
1,601.16
3
533.72
21.17376
1.31 x 10⁻¹⁰
2.699394
Within groups
2,419.84
96
25.20667
Total
4,021
99
Statistical software can provide hypothesis testing and give the actual value of F. If the value is below the critical F value, a value based on the accepted risk, then the null hypothesis is not rejected. Otherwise, the null hypothesis is rejected to confirm that there is a relationship between the factor and the response. Table 2 shows that the F is high, so there is a significant variation in the data. The practitioner can conclude that there is a difference in the lot means.Two-level Factorial DesignThis is the most important design for experimentation. It is used in most experiments because it is simple, versatile and can be used for many factors. In this design, the factors are varied at two levels – low and high.Two-level designs have many advantages. Two are:1. The size of the experiment is much smaller than other designs.2. The interactions of the factors can be detected.For an example of a two-level factorial design, consider the cake-baking process. Three factors are studied: the brand of flour, the temperature of baking and the baking time. The associated lows and highs of these factors are listed in Table 3.Table 3: Cake-baking Factors and Their Associated Levels
Factor
Name
Units
Low Level (-)
High Level (+)
A
Flour brand
Cost
Cheap
Costly
B
Time
Minutes
10
15
C
Temperature
Degrees (C)
70
80
The output responses considered are “taste” and “crust formation.” Taste was determined by a panel of experts, who rated the cake on a scale of 1 (worst) to 10 (best). The ratings were averaged and multiplied by 10. Crust formation is measured by the weight of the crust, the lower the better.The experiment design, with the responses, is shown in Table 4.Table 4: Settings of Input Factors and the Resulting Responses
Run Order
A: Brand
B: Time (min)
C: Temp. (C)
_Y1_: Taste (rating)
_Y2_: Crust (grams)
1
Costly(+)
10(-)
70(-)
75
0.3
2
Cheap(-)
15(+)
70(-)
71
0.7
3
Cheap(-)
10(-)
80(+)
81
1.2
4
Costly(+)
15(+)
70(-)
80
0.7
5
Costly(+)
10(-)
80(+)
77
0.9
6
Costly(+)
15(+)
80(+)
32
0.3
7
Cheap(-)
15(+)
80(+)
42
0.5
8
Cheap(-)
10(-)
70(-)
74
3.1
Analysis of the results is shown in Table 5. Figures 2 through 4 show the average taste scores for each factor as it changes from low to high levels. Figures 5 through 7 are interaction plots; they show the effect of the combined manipulation of the factors. Table 5: ANOVA Table for the Taste Response
Factor
df
SS
MS
F
Effect
Contrast
p
F-crit at 1%
Brand
1
2.0
2.0
0.0816
-1
-4.00
0.82
16.47
Time
1
840.5
840.5
34.306
-20.5
-82.00
0.11
Brand x time
1
0.5
0.5
0.0204
0.5
2.00
0.91
Temp
1
578.0
578.0
23.592
-17
-68.00
0.13
Brand x temp
1
72.0
72.0
2.9388
-6
-24.00
0.34
Time x temp
1
924.5
924.5
37.735
-21.5
-86.00
0.10
Brand x time x temp
1
24.5
24.5
1
-3.5
-14.00
0.50
Error
1
24.5
24.5
Total
7
2442.0
Figure 2: Average Taste Scores for Low and High Flour Brand LevelsFigure 3: Average Taste Scores for Low and High Bake Time (Minutes) LevelsFigure 4: Average Taste Scores for Low and High Baking Temperature (C) LevelsFigure 5: Average Taste Scores for Flour Brand by Time (Minutes)Figure 6: Average Taste Scores for Flour Brand by Temperature (C)Figure 7: Average Taste Scores for Time (Minutes) by Temperature (C)From reading an http://faculty.vassar.edu/lowry/PDF/Ftable.pdf, the critical F value at 1 percent is 16.47. As the actual value of F for time and temperature exceed this value (time is at 34.306 and temperature is 23.592), it’s possible to conclude that both of them have a significant effect on the taste of the product. This is also evident from Figures 3 and 4, where the line is steep for the variation of these two factors. Figure 7 also shows that when the temperature is high, the taste sharply decreases with time (as charring takes place).For the crust formation, the data analysis is shown in Table 6.Table 6: ANOVA Table for the Crust Response
Factor
df
SS
MS
F
Effect
Contrast
F-crit at 1%
Brand
1
1.4
1.4
1.4938
-0.825
-3.30
16.47
Time
1
1.4
1.4
1.4938
-0.825
-3.30
Brand x time
1
1.1
1.1
1.1536
0.725
2.90
Temp
1
0.5
0.5
0.4952
-0.475
-1.90
Brand x temp
1
0.7
0.7
0.7257
0.575
2.30
Time x temp
1
0.1
0.1
0.0672
0.175
0.70
Brand x time x temp
1
0.9
0.9
1
-0.675
-2.70
Error
1
0.9
0.9
Total
7
5.9
In this case the actual F value for the three factors (brand, time and temperature) are below the critical F value for 1 percent (16.47). This shows that these are not significant factors for the crust formation in the cake. If further optimization of the crust formation is needed, then other factors, such as the quantity of ingredients in the cake (eggs, sugar and so on), should be checked.Versatile Tool for PractitionersDesign of experiments is a powerful tool in Six Sigma to manage the significant input factors in order to optimize the desired output. Factorial experiments are versatile because many factors can be modified and studied at once. The following resources can be helpful in learning more about DOEs:1. _DOE Simplified Practical Tools for Effective Experimentation_ (Productivity Inc., 2000)2. _Design and Analysis of Experiments_ (John Wiley and Sons, 1997)About the Author: _K. Sundararajan__ is the regional quality assurance director, greater Asia, for International Flavours and Fragrances Inc. He is a Black Belt and has been a trainer and practicing quality professional for more than 20 years. He can be reached at __mailto:k.sundararajan@iff.com __This e-mail address is being protected from spambots. You need JavaScript enabled to view it __._
没有找到相关结果
已邀请:


9 个回复
小编H (威望:4) (广东 广州) 互联网 员工
赞同来自: