
第六篇——Analyzing Experiments with Ordered Categorical Data
本帖最后由 小编H 于 2011-5-10 11:27 编辑 _
大家好,我是小编H。组员们对第六篇文章翻译有什么意见或者建议,请跟帖回复讨论,以便对文章翻译进行最后的确认。有任何疑问可以发短信息或者邮箱mailto:xbH@6sq.net咨询.Ps:本篇最后由http://www.6sq.net/space-uid-409107.html校稿
Analyzing Experiments with Ordered Categorical Data(对有序离散统计数据进行试验分析)Six Sigma projects(项目) often deal with experiments whose outcomes are ordered categorical data, rather than continuous. It is important to know the right analysis methods for these cases, such as Jeng and Guo’s weighted probability-scoring scheme (WPSS). By Liem Ferryanto 作者:列姆·范瑞安托六西格玛项目经常处理一些试验,这些试验的结果都是有序离散分布的,而不是连续的。对于这种情况,使用适宜的分析方法是非常重要的,例如Jeng 和 Guo的权重概率得分表法(WPSS)。Six Sigma projects in various industries often deal with experiments whose outcomes are not continuous variable data, but ordered categorical data. Analysis of variables (ANOVA) is a technique used to analyze continuously experimental data, but is not adequate for analyzing categorical experimental outcomes. Fortunately, many other methods have been developed to deal with categorical experiments, such as Jeng and Guo’s weighted probability-scoring scheme (WPSS).很多制造业的六西格玛项目经常处理一些结果是有序离散型而非连续变量数据的试验。方差分析法常用来分析连续型试验数据,但并不适合用来分析离散型试验结果。很幸运,也产生了很多其它的方法来处理这些离散试验结果,比如Jeng 和 Guo的权重概率得分表法(WPSS)。The WPSS technique is interpretable and easy to implement in a spreadsheet software program. The following case study, which involves medical devices, serves as an example of how a modified WPSS technique can be used to analyze experiments with ordered categorical data.在电子表格软件中WPSS法可以很容易进行演示和运用。下面举个医疗设备的实例,来说明运用改进型WPSS法是如何处理有序离散试验数据的。Determining the Best Factors确定最重要的因子This study explores the influence of contact lens design factors on outcomes related to ease of lens insertion, meaning how easy it is to put patients’ contact lenses in their eyes. Soft contact lenses are thin pieces of plastic or glass that float on the tear film on the surface of the cornea. They are shaped to fit the user's eye and are used to correct refractive errors such as nearsightedness, farsightedness and unequal curvature of the cornea (astigmatism). For this example, only three lens design factors of a certain lens type with fixed material properties are considered: lens thickness profile (3 levels), base curve dimension (3 levels) and base curve profile (2 levels). Determining the ease of insertion is a five-step process.这项实验研究的是隐形眼镜设计因子对戴隐形眼镜的舒适度有什么影响,也就是怎样才能让病人戴上隐形眼镜更舒服。柔软的隐形眼镜都是薄片塑料或玻璃,覆在角膜表面的泪膜上。它们被做成适合用户眼睛的形状,用来矫正近视眼、远视眼、散光眼的折射角度。比如对于一种具有特定材料属性的隐形眼镜仅考虑三方面的设计因子:隐形眼镜的剖面厚度(三水平)、基线尺寸(三水平)、基线轮廓(二水平)。确定戴隐形眼镜的舒适度分为5个步骤。Step 1: Design an Experiment第1步:试验设计Because this is an exploratory experiment, an L9 orthogonal matrix is used. The design matrix with the three lens design factors is shown in Table 1.因为这是个探索性试验,我们采用L9正交矩阵表。表1中的矩阵表列出了隐形眼镜的三项设计因子
Table 1: L9 Orthogonal Matrix of Three Lens Design Factors表1:三设计因子矩阵表
Design Factors设计因子
Experiment Number实验序号
Thickness profile隐形眼镜的剖面厚度
Base curve dimension基线尺寸
Base curve profile基线轮廓
1
1
1
1
2
1
2
2
3
1
3
1
4
2
1
2
5
2
2
1
6
2
3
1
7
3
1
1
8
3
2
1
9
3
3
2
Step 2: Plan Number of Samples and Data Categorization第2步:对采样和数据种类进行编号In small clinical trials, nine trained contact lens wearers are asked to try each of the nine lens designs from the L9 matrix and give their opinion on the ease of insertion. Each time a patient inserts a lens in their eye, they are asked to rate how easy it was to do. Their responses are integer numbers from 1 to 10, with the worst condition rated 1 (the patient cannot insert the lens) to the best condition rated 10 (the patient needs only one trial and the lens immediately sits on the right location of the eye). The ratings are grouped into four categories of ease of insertion:在小的临床试验中,9个经过培训的隐形眼镜佩戴者被要求分别试戴L9矩阵表中1-9种隐形眼镜,并对戴上眼镜的舒适度进行评价。每次他们戴上眼镜后,他们必须回答眼镜的舒适级别,他们的回答都是从1到10的整数,其中1表示最坏的情况(眼镜戴不到眼睛里),10表示最好的情况(只需1次就可以戴到眼睛里,眼镜也很快调整到合适的位置)。这10个舒适级别又被归为4类:l Category I (very easy to insert): Ratings 9 – 10 第I类(非常容易戴):9-10级l Category II (easy to insert): Ratings 7 – 8 第II类(容易戴):7-8级l Category III (moderate to insert): Ratings 5 – 6 第III类(不太容易戴):5-6级l Category IV (difficult to insert): Ratings 1- 4第IV类(难戴):1-4级The design matrix with the outcomes for each run is shown in Table 2.每轮的结果填写在矩阵表2中。
Table 2: Insertion Ratings Grouped By Category表2: 归类后的舒适级别统计
Design Factors设计因子
Number of Observation By Category归类后的统计数
Experiment Number轮数
Thickness profile隐性眼镜的剖面厚度
Base curve dimension基线尺寸
Base curve profile基线轮廓
I
II
III
IV
Total总数
1
1
1
1
1
2
5
1
9
2
1
2
2
3
3
3
0
9
3
1
3
1
4
2
2
1
9
4
2
1
2
2
2
3
2
9
5
2
2
1
4
4
1
0
9
6
2
3
1
1
3
1
4
9
7
3
1
1
5
3
1
0
9
8
3
2
1
2
5
1
1
9
9
3
3
2
4
1
4
0
9
Step 3: Calculate Probability of the Outcomes Per Category and Run第3步:对每类、每轮结果计算概率In order to estimate the location and dispersion effects of each run, the scores of each category of each run must be transformed into probability values. Let i be an experiment run, for i = 1, 2,…I (in this example, I = 9) and j be a category of experimental outcomes, for j = I, II,…J (in this example J = IV). Then it is possible to calculate the probability (proportion) that an outcome is placed in j-th category of i-th run, i.e. pij, as the following:pij = nij/si为了评估每轮的位置效应和散度效应,每轮的每类分数必须转化成概率值。用i代表一轮,即i=1,2,…I(在此例中,I=9),用j代表试验结果的类别,即j= I, II,…J(此例中J= IV)。然后我们就可以计算第i轮中第j类的概率pij了,如下:pij = nij/siwhere nij is the number of outcomes in j-th category of i-th run and si is the total outcomes of all categories in the i-th run.此处,nij是第i轮中第j类的结果数,si是第i轮中所有类别的总结果。For example, the probability of an outcome being placed in the III-th category of the 1st run is p1III = n1III/s1 = 5/9 = 0.56. The probability of the outcome in each category of each run is shown in Table 3.例如,第1轮中第III类的概率是p1III = n1III/s1 = 5/9 = 0.56。在每一轮中每一类的概率在表3中
Table 3: Probability of Outcomes表3: 概率值
**Number of Observation
By Categories归类后的统计数
Probabilities for Each Category每一类的概率
Experiment Number轮数
I
II
III
IV
Total
(I)
(II)
(III)
(IV)
1
1
2
5
1
9
0.11
0.22
0.56
0.11
2
3
3
3
0
9
0.33
0.33
0.33
0.00
3
4
2
2
1
9
0.44
0.22
0.22
0.11
4
2
2
3
2
9
0.22
0.22
0.33
0.22
5
4
4
1
0
9
0.44
0.44
0.11
0.00
6
1
3
1
4
9
0.11
0.33
0.11
0.44
7
5
3
1
0
9
0.56
0.33
0.11
0.00
8
2
5
1
1
9
0.22
0.56
0.11
0.11
9
4
1
4
0
9
0.44
0.11
0.44
0.00
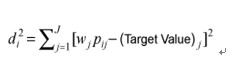
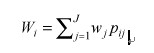
Step 4: Estimate Location and Dispersion Effects of Each Run第4步:评估每一轮的位置效应和散度效应Given each category j has a weight wj, which is the upper limit of the j-th category rate, the location scores Wi for the i-th run is defined by假如每类j的权重是wj,这是第j类比率的上限,则第i轮的位置分Wi定义为The rationale for using the upper limit of the category rate is that the weight should reflect the rating values. The dispersion score di2 is defined by使用类别比率的最高限的原因是权重应反映比率值。散度分di2(di的平方)定义为where the target values are defined as {The upper limit of the I-st category rate, 0, 0, …, 0} for categories {I, II, III, … ,J}, respectively.此处“Target Value”表示:类别{I, II, III, … ,J}分别对应的目标值为{第I类比率的上限, 0, 0, …, 0}The rationale of setting the target values is that only outcomes that fall in the best category are rewarded. For example, the location and dispersion scores for the 1st run are W1 = 100.11 + 80.22 + 60.56 + 40.11 = 6.7 and d12 = 2 + 2 + 2+ 2 = 93.48. The location and dispersion scores of the outcomes of each run are shown in Table 4.设立目标值的原因是只有处于最好的类别中的结果才应该奖励。例如第1轮位置分为W1 = 100.11 + 80.22 + 60.56 + 40.11 = 6.7 ,第1轮的散度分为 d12 = 2 + 2 + 2+ 2 = 93.48.每轮结果的位置分和散度分在表4中
Table 4: Location, Dispersion and Mean Square Deviation Scores表4:位置分,散度分与均方偏差分
Experiment Number
Design Factor 设计因子- Thickness Profile剖面厚度
Design Factor - Base Curve Dimension基线尺寸
Design Factor - Base Curve Profile基线轮廓
Location Scores (_Wi_)位置分
Dispersion Scores (di2)散度分
MSD均方偏差
1
1
1
1
6.7
93.5
0.16
2
1
2
2
8.0
55.6
0.06
3
1
3
1
8.0
36.0
0.04
4
2
1
2
6.9
68.4
0.11
5
2
2
1
8.7
44.0
0.04
6
2
3
1
6.2
89.7
0.21
7
3
1
1
8.9
27.3
0.03
8
3
2
1
7.8
80.9
0.08
9
3
3
2
8.0
38.8
0.04
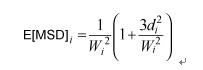
One performance measure to combine location and dispersion effects is mean square deviation (MSD), which allows practitioners to make judgments in one step. If any outcome is the larger-the-better characteristic, then its expected MSD can be approximately expressed in terms of location and dispersion effects as follows:复合位置效应和散度效应的指标测量法就是MSD,它让试验者做出进一步的判定。如果任何结果具有越大越好的特点,那它的MSD期望值与位置效应、散度效应之间的关系大体可表达为:
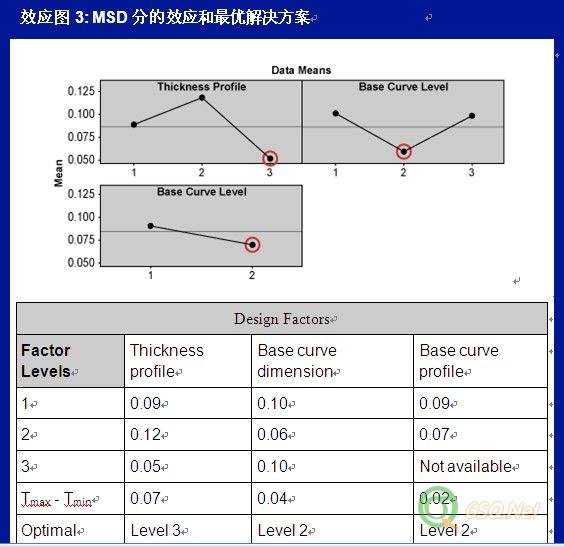
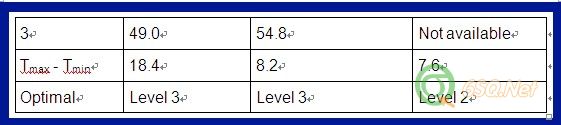
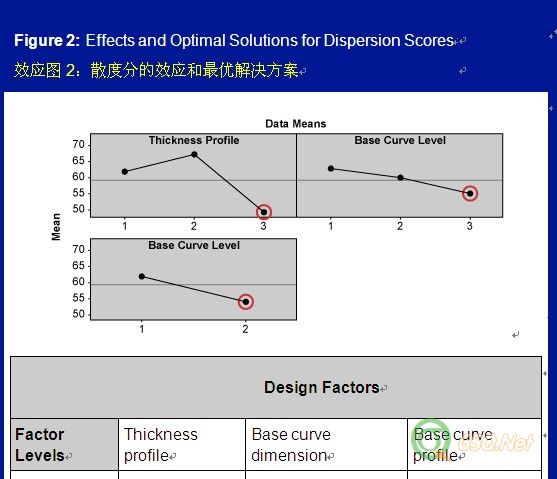
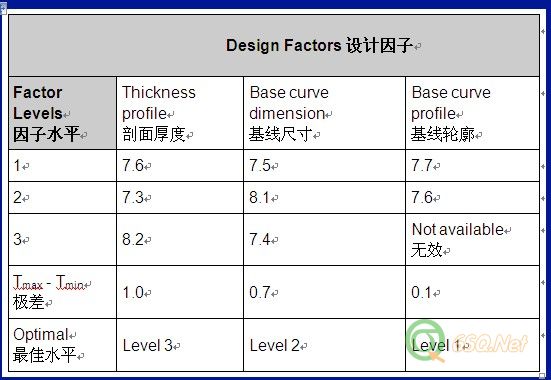
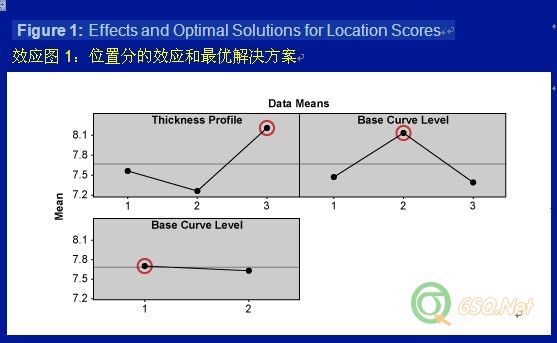
For example, the expected MSD for 1st run is E1 = 1/(6.67)2 (1+ (393.5)/(6.67)2) = 0.16. The MSD scores for all runs are given in Table 4.例如,第1轮的MSD期望值为E1 = 1/(6.67)2 (1+ (393.5)/(6.67)2) = 0.16.每轮的MSD分数已显示在表4中。The location, dispersion and expected MSD effects for each design factors are shown as Tmax-Tmin (Figures 1, 2, 3). Higher Tmax-Tmin values or steeper main effects curves indicate a stronger influence of that design factor on the outcomes.位置、散度、MSD期望值对每个设计因子的效应用极差(Tmax-Tmin)来说明(见如下图表1,2,3)。如果Tmax-Tmin极差值越高或主效应曲线越陡,说明此设计因子对结果的效应越大。
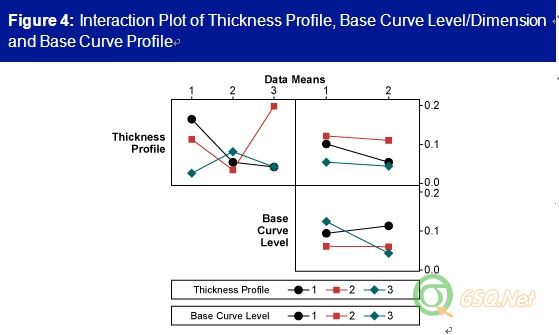
Step 5: Determine Optimal Solutions第5步:确定最优解决方案The level of a particular design factor with the highest location value, the lowest dispersion value or the lowest expected MSD value is the optimal solution for each of those factors, respectively. The optimal solution based on the expected MSD criteria(标准) is the optimal trade-off between maximal location and minimal dispersion scores.如果某一设计因子的水平具有最高位置分、最低散度分或最低预期MSD分,那么这一水平就是针对此设计因子的最优解决方案。基于预期MSD标准的最优解决方案是在最高位置分与最低散度分之间寻找了一个平衡点。The predicted optimal solution based on the expected MSD criteria is thickness profile at level 3, base curve dimension at level 2 and base curve profile at level 2. But if practitioners know there are interaction effects among design factors, they cannot depend solely on the main effect values or plots to choose the settings of design factors. The interaction plot(交互作用) for the expected MSD effects(预期MSD的影响) shows that thickness profile heavily interacts with base curve level/dimension (Figure 4). A small interaction also exists between base curve dimension and base curve profile. After taking interaction effects into consideration, practitioners need to examine whether the chosen optimal design factor levels still give optimal effects to the experiment outcomes.基于预期MSD标准的预期最优解决方案是隐形眼镜的剖面厚度的第三水平、基线尺寸的第二水平、基线轮廓的第二水平。但如果试验者知道各设计因子间是有交互影响的,他们就不会只考虑主效应值或关键影响点来选择设计因子的设置。能够影响预期MSD值的交互作用是:隐形眼镜的剖面厚度与基线尺寸有很强的交互作用,基线尺寸和基线轮廓之间的交互作用比较弱(见图表4)。把这些交互作用考虑进来以后,试验者需要检测我们选择的最优设计因子水平是否仍然产生最优的试验结果。
In this case, thickness profile at level 3 gives almost consistently the lowest MSD scores for different levels of base curve dimension and also consistently gives the lowest MSD scores for different levels of base curve profile. Thus, it gives the optimal effect to the experiment outcomes. Base curve dimension at level 2 almost consistently gives the lowest MSD scores for different levels of thickness profile and also consistently gives the lowest MSD score for different levels of base curve profile. Thus, it too gives the optimal effect to the experiment outcomes. The Tmax-Tmin value of the base curve profile is the lowest and its curve is flat. Thus, base curve profile has insignificant influence on the outcomes, and can be set at either level 1 or 2. Therefore, the expected MSD predicts that lens design with thickness profile at level 3, base curve dimension at level 2 and base curve profile at either level 1 or 2 would give the optimal ease of insertion.既然这样,不管基线尺寸和基线轮廓这两个设计因子的水平如何,隐形眼镜剖面厚度的第三水平均会对应最低的MSD值,因此,它是最优选择。基线尺寸的第二水平对于不同水平的隐形眼镜剖面厚度和基线轮廓均表现出最低的MSD值,因此,基线尺寸第二水平也是最优选择。基线轮廓的(Tmax-Tmin)极差值是最小的,并且它的曲线是平的,因此,基线轮廓对实验结果的影响非常小,可以选择第1或2水平。因此预期MSD显示出在隐形眼镜剖面厚度的第三水平、基线尺寸的第二水平、基线轮廓的1或2水平条件下隐形眼镜的舒适度最好。Easy to Implement Optimization Method轻松执行最优方法A modified WPSS is a simple and straightforward method for dealing with ordered categorical data. This case study shows that a single performance measure MSD derived from WPSS can provide insight to(直观) a system through experiments and can direct practitioners to the optimal solution.修正后的WPSS法可以非常简单直观的处理有序离散数据。这个试验实例说明:运用WPSS法来获取独立的工作衡量(即MSD),它可以通过试验建立一个直观的系统并且指导试验者得到最优解决方案。About the Author: Liem Ferryanto, Ph.D., is project director and Six Sigma Champion of global research, development and engineering at CIBA Vision Corp., a Novartis company, in Duluth, Ga., USA. He can be reached at mailto:lferryanto@gmail.com 作者简介:列姆·范瑞安托博士,是CIBA视觉公司(位于美国明尼苏达州的德鲁斯)全球研究、研发、工程方面的六西格玛倡导者和项目总监。你可以通过邮箱 mailto:lferryanto@gmail.com 和他联系
大家好,我是小编H。组员们对第六篇文章翻译有什么意见或者建议,请跟帖回复讨论,以便对文章翻译进行最后的确认。有任何疑问可以发短信息或者邮箱mailto:xbH@6sq.net咨询.Ps:本篇最后由http://www.6sq.net/space-uid-409107.html校稿
Analyzing Experiments with Ordered Categorical Data(对有序离散统计数据进行试验分析)Six Sigma projects(项目) often deal with experiments whose outcomes are ordered categorical data, rather than continuous. It is important to know the right analysis methods for these cases, such as Jeng and Guo’s weighted probability-scoring scheme (WPSS). By Liem Ferryanto 作者:列姆·范瑞安托六西格玛项目经常处理一些试验,这些试验的结果都是有序离散分布的,而不是连续的。对于这种情况,使用适宜的分析方法是非常重要的,例如Jeng 和 Guo的权重概率得分表法(WPSS)。Six Sigma projects in various industries often deal with experiments whose outcomes are not continuous variable data, but ordered categorical data. Analysis of variables (ANOVA) is a technique used to analyze continuously experimental data, but is not adequate for analyzing categorical experimental outcomes. Fortunately, many other methods have been developed to deal with categorical experiments, such as Jeng and Guo’s weighted probability-scoring scheme (WPSS).很多制造业的六西格玛项目经常处理一些结果是有序离散型而非连续变量数据的试验。方差分析法常用来分析连续型试验数据,但并不适合用来分析离散型试验结果。很幸运,也产生了很多其它的方法来处理这些离散试验结果,比如Jeng 和 Guo的权重概率得分表法(WPSS)。The WPSS technique is interpretable and easy to implement in a spreadsheet software program. The following case study, which involves medical devices, serves as an example of how a modified WPSS technique can be used to analyze experiments with ordered categorical data.在电子表格软件中WPSS法可以很容易进行演示和运用。下面举个医疗设备的实例,来说明运用改进型WPSS法是如何处理有序离散试验数据的。Determining the Best Factors确定最重要的因子This study explores the influence of contact lens design factors on outcomes related to ease of lens insertion, meaning how easy it is to put patients’ contact lenses in their eyes. Soft contact lenses are thin pieces of plastic or glass that float on the tear film on the surface of the cornea. They are shaped to fit the user's eye and are used to correct refractive errors such as nearsightedness, farsightedness and unequal curvature of the cornea (astigmatism). For this example, only three lens design factors of a certain lens type with fixed material properties are considered: lens thickness profile (3 levels), base curve dimension (3 levels) and base curve profile (2 levels). Determining the ease of insertion is a five-step process.这项实验研究的是隐形眼镜设计因子对戴隐形眼镜的舒适度有什么影响,也就是怎样才能让病人戴上隐形眼镜更舒服。柔软的隐形眼镜都是薄片塑料或玻璃,覆在角膜表面的泪膜上。它们被做成适合用户眼睛的形状,用来矫正近视眼、远视眼、散光眼的折射角度。比如对于一种具有特定材料属性的隐形眼镜仅考虑三方面的设计因子:隐形眼镜的剖面厚度(三水平)、基线尺寸(三水平)、基线轮廓(二水平)。确定戴隐形眼镜的舒适度分为5个步骤。Step 1: Design an Experiment第1步:试验设计Because this is an exploratory experiment, an L9 orthogonal matrix is used. The design matrix with the three lens design factors is shown in Table 1.因为这是个探索性试验,我们采用L9正交矩阵表。表1中的矩阵表列出了隐形眼镜的三项设计因子
Table 1: L9 Orthogonal Matrix of Three Lens Design Factors表1:三设计因子矩阵表
Design Factors设计因子
Experiment Number实验序号
Thickness profile隐形眼镜的剖面厚度
Base curve dimension基线尺寸
Base curve profile基线轮廓
1
1
1
1
2
1
2
2
3
1
3
1
4
2
1
2
5
2
2
1
6
2
3
1
7
3
1
1
8
3
2
1
9
3
3
2
Step 2: Plan Number of Samples and Data Categorization第2步:对采样和数据种类进行编号In small clinical trials, nine trained contact lens wearers are asked to try each of the nine lens designs from the L9 matrix and give their opinion on the ease of insertion. Each time a patient inserts a lens in their eye, they are asked to rate how easy it was to do. Their responses are integer numbers from 1 to 10, with the worst condition rated 1 (the patient cannot insert the lens) to the best condition rated 10 (the patient needs only one trial and the lens immediately sits on the right location of the eye). The ratings are grouped into four categories of ease of insertion:在小的临床试验中,9个经过培训的隐形眼镜佩戴者被要求分别试戴L9矩阵表中1-9种隐形眼镜,并对戴上眼镜的舒适度进行评价。每次他们戴上眼镜后,他们必须回答眼镜的舒适级别,他们的回答都是从1到10的整数,其中1表示最坏的情况(眼镜戴不到眼睛里),10表示最好的情况(只需1次就可以戴到眼睛里,眼镜也很快调整到合适的位置)。这10个舒适级别又被归为4类:l Category I (very easy to insert): Ratings 9 – 10 第I类(非常容易戴):9-10级l Category II (easy to insert): Ratings 7 – 8 第II类(容易戴):7-8级l Category III (moderate to insert): Ratings 5 – 6 第III类(不太容易戴):5-6级l Category IV (difficult to insert): Ratings 1- 4第IV类(难戴):1-4级The design matrix with the outcomes for each run is shown in Table 2.每轮的结果填写在矩阵表2中。
Table 2: Insertion Ratings Grouped By Category表2: 归类后的舒适级别统计
Design Factors设计因子
Number of Observation By Category归类后的统计数
Experiment Number轮数
Thickness profile隐性眼镜的剖面厚度
Base curve dimension基线尺寸
Base curve profile基线轮廓
I
II
III
IV
Total总数
1
1
1
1
1
2
5
1
9
2
1
2
2
3
3
3
0
9
3
1
3
1
4
2
2
1
9
4
2
1
2
2
2
3
2
9
5
2
2
1
4
4
1
0
9
6
2
3
1
1
3
1
4
9
7
3
1
1
5
3
1
0
9
8
3
2
1
2
5
1
1
9
9
3
3
2
4
1
4
0
9
Step 3: Calculate Probability of the Outcomes Per Category and Run第3步:对每类、每轮结果计算概率In order to estimate the location and dispersion effects of each run, the scores of each category of each run must be transformed into probability values. Let i be an experiment run, for i = 1, 2,…I (in this example, I = 9) and j be a category of experimental outcomes, for j = I, II,…J (in this example J = IV). Then it is possible to calculate the probability (proportion) that an outcome is placed in j-th category of i-th run, i.e. pij, as the following:pij = nij/si为了评估每轮的位置效应和散度效应,每轮的每类分数必须转化成概率值。用i代表一轮,即i=1,2,…I(在此例中,I=9),用j代表试验结果的类别,即j= I, II,…J(此例中J= IV)。然后我们就可以计算第i轮中第j类的概率pij了,如下:pij = nij/siwhere nij is the number of outcomes in j-th category of i-th run and si is the total outcomes of all categories in the i-th run.此处,nij是第i轮中第j类的结果数,si是第i轮中所有类别的总结果。For example, the probability of an outcome being placed in the III-th category of the 1st run is p1III = n1III/s1 = 5/9 = 0.56. The probability of the outcome in each category of each run is shown in Table 3.例如,第1轮中第III类的概率是p1III = n1III/s1 = 5/9 = 0.56。在每一轮中每一类的概率在表3中
Table 3: Probability of Outcomes表3: 概率值
**Number of Observation
By Categories归类后的统计数
Probabilities for Each Category每一类的概率
Experiment Number轮数
I
II
III
IV
Total
(I)
(II)
(III)
(IV)
1
1
2
5
1
9
0.11
0.22
0.56
0.11
2
3
3
3
0
9
0.33
0.33
0.33
0.00
3
4
2
2
1
9
0.44
0.22
0.22
0.11
4
2
2
3
2
9
0.22
0.22
0.33
0.22
5
4
4
1
0
9
0.44
0.44
0.11
0.00
6
1
3
1
4
9
0.11
0.33
0.11
0.44
7
5
3
1
0
9
0.56
0.33
0.11
0.00
8
2
5
1
1
9
0.22
0.56
0.11
0.11
9
4
1
4
0
9
0.44
0.11
0.44
0.00
Step 4: Estimate Location and Dispersion Effects of Each Run第4步:评估每一轮的位置效应和散度效应Given each category j has a weight wj, which is the upper limit of the j-th category rate, the location scores Wi for the i-th run is defined by假如每类j的权重是wj,这是第j类比率的上限,则第i轮的位置分Wi定义为The rationale for using the upper limit of the category rate is that the weight should reflect the rating values. The dispersion score di2 is defined by使用类别比率的最高限的原因是权重应反映比率值。散度分di2(di的平方)定义为where the target values are defined as {The upper limit of the I-st category rate, 0, 0, …, 0} for categories {I, II, III, … ,J}, respectively.此处“Target Value”表示:类别{I, II, III, … ,J}分别对应的目标值为{第I类比率的上限, 0, 0, …, 0}The rationale of setting the target values is that only outcomes that fall in the best category are rewarded. For example, the location and dispersion scores for the 1st run are W1 = 100.11 + 80.22 + 60.56 + 40.11 = 6.7 and d12 = 2 + 2 + 2+ 2 = 93.48. The location and dispersion scores of the outcomes of each run are shown in Table 4.设立目标值的原因是只有处于最好的类别中的结果才应该奖励。例如第1轮位置分为W1 = 100.11 + 80.22 + 60.56 + 40.11 = 6.7 ,第1轮的散度分为 d12 = 2 + 2 + 2+ 2 = 93.48.每轮结果的位置分和散度分在表4中
Table 4: Location, Dispersion and Mean Square Deviation Scores表4:位置分,散度分与均方偏差分
Experiment Number
Design Factor 设计因子- Thickness Profile剖面厚度
Design Factor - Base Curve Dimension基线尺寸
Design Factor - Base Curve Profile基线轮廓
Location Scores (_Wi_)位置分
Dispersion Scores (di2)散度分
MSD均方偏差
1
1
1
1
6.7
93.5
0.16
2
1
2
2
8.0
55.6
0.06
3
1
3
1
8.0
36.0
0.04
4
2
1
2
6.9
68.4
0.11
5
2
2
1
8.7
44.0
0.04
6
2
3
1
6.2
89.7
0.21
7
3
1
1
8.9
27.3
0.03
8
3
2
1
7.8
80.9
0.08
9
3
3
2
8.0
38.8
0.04
One performance measure to combine location and dispersion effects is mean square deviation (MSD), which allows practitioners to make judgments in one step. If any outcome is the larger-the-better characteristic, then its expected MSD can be approximately expressed in terms of location and dispersion effects as follows:复合位置效应和散度效应的指标测量法就是MSD,它让试验者做出进一步的判定。如果任何结果具有越大越好的特点,那它的MSD期望值与位置效应、散度效应之间的关系大体可表达为:
For example, the expected MSD for 1st run is E1 = 1/(6.67)2 (1+ (393.5)/(6.67)2) = 0.16. The MSD scores for all runs are given in Table 4.例如,第1轮的MSD期望值为E1 = 1/(6.67)2 (1+ (393.5)/(6.67)2) = 0.16.每轮的MSD分数已显示在表4中。The location, dispersion and expected MSD effects for each design factors are shown as Tmax-Tmin (Figures 1, 2, 3). Higher Tmax-Tmin values or steeper main effects curves indicate a stronger influence of that design factor on the outcomes.位置、散度、MSD期望值对每个设计因子的效应用极差(Tmax-Tmin)来说明(见如下图表1,2,3)。如果Tmax-Tmin极差值越高或主效应曲线越陡,说明此设计因子对结果的效应越大。
Step 5: Determine Optimal Solutions第5步:确定最优解决方案The level of a particular design factor with the highest location value, the lowest dispersion value or the lowest expected MSD value is the optimal solution for each of those factors, respectively. The optimal solution based on the expected MSD criteria(标准) is the optimal trade-off between maximal location and minimal dispersion scores.如果某一设计因子的水平具有最高位置分、最低散度分或最低预期MSD分,那么这一水平就是针对此设计因子的最优解决方案。基于预期MSD标准的最优解决方案是在最高位置分与最低散度分之间寻找了一个平衡点。The predicted optimal solution based on the expected MSD criteria is thickness profile at level 3, base curve dimension at level 2 and base curve profile at level 2. But if practitioners know there are interaction effects among design factors, they cannot depend solely on the main effect values or plots to choose the settings of design factors. The interaction plot(交互作用) for the expected MSD effects(预期MSD的影响) shows that thickness profile heavily interacts with base curve level/dimension (Figure 4). A small interaction also exists between base curve dimension and base curve profile. After taking interaction effects into consideration, practitioners need to examine whether the chosen optimal design factor levels still give optimal effects to the experiment outcomes.基于预期MSD标准的预期最优解决方案是隐形眼镜的剖面厚度的第三水平、基线尺寸的第二水平、基线轮廓的第二水平。但如果试验者知道各设计因子间是有交互影响的,他们就不会只考虑主效应值或关键影响点来选择设计因子的设置。能够影响预期MSD值的交互作用是:隐形眼镜的剖面厚度与基线尺寸有很强的交互作用,基线尺寸和基线轮廓之间的交互作用比较弱(见图表4)。把这些交互作用考虑进来以后,试验者需要检测我们选择的最优设计因子水平是否仍然产生最优的试验结果。
In this case, thickness profile at level 3 gives almost consistently the lowest MSD scores for different levels of base curve dimension and also consistently gives the lowest MSD scores for different levels of base curve profile. Thus, it gives the optimal effect to the experiment outcomes. Base curve dimension at level 2 almost consistently gives the lowest MSD scores for different levels of thickness profile and also consistently gives the lowest MSD score for different levels of base curve profile. Thus, it too gives the optimal effect to the experiment outcomes. The Tmax-Tmin value of the base curve profile is the lowest and its curve is flat. Thus, base curve profile has insignificant influence on the outcomes, and can be set at either level 1 or 2. Therefore, the expected MSD predicts that lens design with thickness profile at level 3, base curve dimension at level 2 and base curve profile at either level 1 or 2 would give the optimal ease of insertion.既然这样,不管基线尺寸和基线轮廓这两个设计因子的水平如何,隐形眼镜剖面厚度的第三水平均会对应最低的MSD值,因此,它是最优选择。基线尺寸的第二水平对于不同水平的隐形眼镜剖面厚度和基线轮廓均表现出最低的MSD值,因此,基线尺寸第二水平也是最优选择。基线轮廓的(Tmax-Tmin)极差值是最小的,并且它的曲线是平的,因此,基线轮廓对实验结果的影响非常小,可以选择第1或2水平。因此预期MSD显示出在隐形眼镜剖面厚度的第三水平、基线尺寸的第二水平、基线轮廓的1或2水平条件下隐形眼镜的舒适度最好。Easy to Implement Optimization Method轻松执行最优方法A modified WPSS is a simple and straightforward method for dealing with ordered categorical data. This case study shows that a single performance measure MSD derived from WPSS can provide insight to(直观) a system through experiments and can direct practitioners to the optimal solution.修正后的WPSS法可以非常简单直观的处理有序离散数据。这个试验实例说明:运用WPSS法来获取独立的工作衡量(即MSD),它可以通过试验建立一个直观的系统并且指导试验者得到最优解决方案。About the Author: Liem Ferryanto, Ph.D., is project director and Six Sigma Champion of global research, development and engineering at CIBA Vision Corp., a Novartis company, in Duluth, Ga., USA. He can be reached at mailto:lferryanto@gmail.com 作者简介:列姆·范瑞安托博士,是CIBA视觉公司(位于美国明尼苏达州的德鲁斯)全球研究、研发、工程方面的六西格玛倡导者和项目总监。你可以通过邮箱 mailto:lferryanto@gmail.com 和他联系
没有找到相关结果
已邀请:


1 个回复
小编H (威望:4) (广东 广州) 互联网 员工
赞同来自: