
江湖救急!“因子及因子交互作用分析”
问题如下:
对全厂进行员工满意度调查,采取随机抽样调查后,可汇总信息如下:
个人信息(Xs)可分为:性别、工龄(≤1年,>1年)、部门(线内,线外)、职称(作业员、职员、干部),籍贯(闽系、川系、鲁系及其他),
每份问卷可汇总为14组问题,每个问题均为5分制,每个被调查者对工厂的满意度得分(Y)析加总汇总即可。
鉴于曾于isixsigma网站上看到一个改善员工满意度的案例(在本版内曾发布过),在用简单的满意比例与不满意比例分析、得分与相关系数矩阵分析以及单因素方差分析后,欲更深入地了解影响员工满意度的原因,想模仿该案例的因子及因子的交互作用分析,奈何实际运用中颇不得手,在这里请教高手,要运用哪些工具才能有以下的结果,以下为该案例分析内容:
因子以及因子的交互作用分析
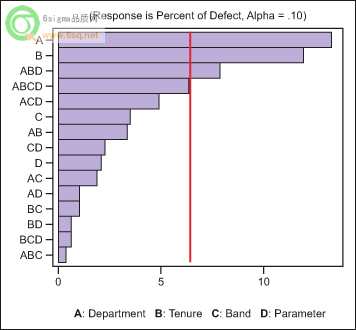
采取4因子2水平分析(如表1)进行因子分析,分析的主要对象是容纳了公司至少70%员工的两个部门。
Table 1: Four Factors, Two Levels
表1:4因子2水平分析法
Factor Level 1 Level 2
部门Department A B
任期Tenure < 1 year > 1 year
职位Band F B
参数Parameter Job Manager
Table 2: Effects
Term Effect Coef.
Constant 54.388
Department -13.325 -6.662
Tenure -11.925 -5.962
Band 3.45 1.725
Parameter 2.125 1.063
Department*Tenure 3.375 1.688
Department*Band 1.9 0.95
Department*Parameter -1.025 -0.513
Tenure*Band 1 0.5
Tenure*Parameter -0.625 -0.313
Band*Parameter -2.3 -1.15
DepartmentTenureBand 0.35 0.175
DepartmentTenureParameter -7.875 -3.938
DepartmentBandParameter 4.9 2.45
TenureBandParameter -0.6 -0.3
DepartmentTenureBand*Parameter -6.4 -3.2
Figure 1: Pareto Chart of the Effects
见附件1:
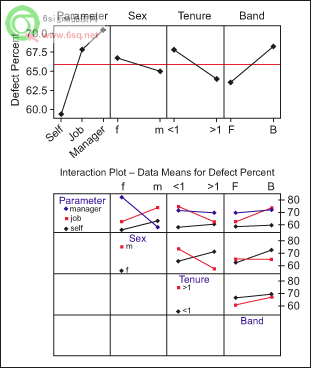
People in Department A with less than one year of tenure in the executive band were found to be relatively more dissatisfied with respect to their jobs. Subsequent interaction analysis was carried out on responses from Department A, on four factors and different levels, as shown in Table 3.
从分析结果中发现A部门员工中任期未满1年的行政人员更多的不满来源其所在岗位。再从A部门的调查反馈中进行4因子不同水平的交互作用分析,如表3:
Table 3: Department A
Parameters Level 3 Job Self Manager
Sex Level 2 Female Male
Band Level 2 F B
Tenure Level 2 < 1 year > 1 year
Figure 2: Interaction Plot for Department A
见附件2:
对全厂进行员工满意度调查,采取随机抽样调查后,可汇总信息如下:
个人信息(Xs)可分为:性别、工龄(≤1年,>1年)、部门(线内,线外)、职称(作业员、职员、干部),籍贯(闽系、川系、鲁系及其他),
每份问卷可汇总为14组问题,每个问题均为5分制,每个被调查者对工厂的满意度得分(Y)析加总汇总即可。
鉴于曾于isixsigma网站上看到一个改善员工满意度的案例(在本版内曾发布过),在用简单的满意比例与不满意比例分析、得分与相关系数矩阵分析以及单因素方差分析后,欲更深入地了解影响员工满意度的原因,想模仿该案例的因子及因子的交互作用分析,奈何实际运用中颇不得手,在这里请教高手,要运用哪些工具才能有以下的结果,以下为该案例分析内容:
因子以及因子的交互作用分析
采取4因子2水平分析(如表1)进行因子分析,分析的主要对象是容纳了公司至少70%员工的两个部门。
Table 1: Four Factors, Two Levels
表1:4因子2水平分析法
Factor Level 1 Level 2
部门Department A B
任期Tenure < 1 year > 1 year
职位Band F B
参数Parameter Job Manager
Table 2: Effects
Term Effect Coef.
Constant 54.388
Department -13.325 -6.662
Tenure -11.925 -5.962
Band 3.45 1.725
Parameter 2.125 1.063
Department*Tenure 3.375 1.688
Department*Band 1.9 0.95
Department*Parameter -1.025 -0.513
Tenure*Band 1 0.5
Tenure*Parameter -0.625 -0.313
Band*Parameter -2.3 -1.15
DepartmentTenureBand 0.35 0.175
DepartmentTenureParameter -7.875 -3.938
DepartmentBandParameter 4.9 2.45
TenureBandParameter -0.6 -0.3
DepartmentTenureBand*Parameter -6.4 -3.2
Figure 1: Pareto Chart of the Effects
见附件1:
People in Department A with less than one year of tenure in the executive band were found to be relatively more dissatisfied with respect to their jobs. Subsequent interaction analysis was carried out on responses from Department A, on four factors and different levels, as shown in Table 3.
从分析结果中发现A部门员工中任期未满1年的行政人员更多的不满来源其所在岗位。再从A部门的调查反馈中进行4因子不同水平的交互作用分析,如表3:
Table 3: Department A
Parameters Level 3 Job Self Manager
Sex Level 2 Female Male
Band Level 2 F B
Tenure Level 2 < 1 year > 1 year
Figure 2: Interaction Plot for Department A
见附件2:
没有找到相关结果
已邀请:


22 个回复
chengyu (威望:0) (安徽 合肥)
赞同来自:
不满意主要来自收入不够:lol: