
Minitab企业实战之MINITAB软件在LEA电子枪工艺设计中的应用

我们在选用一个软件时一方面应该看该软件的功能,同时软件的易用性以及它的使用率也应该进行考虑。找了很多质量方面的书籍,看到一个用Minitab软件解决生产过程中所遇到的一个真实案例。现与大家分享下。
MINITAB软件在LEA电子枪工艺设计中的应用
------上海永新彩色显像管股份有限公司 孙丽文
【摘要】
电子枪被称为显像管的心脏。LEA电子枪是我公司自行开发的一个新产品。而LEA电子枪的G1/K、G1/G2间隙设置对显像管的电特性,尤其是EKCO(截止电压)、8”EWT(8”发射)及40”EWT(40”发射)等电特性有直接影响。因此,确定LEA电子枪的工艺最佳G1/K、G1/G2间隙设置,对确定显像管的最佳电特性值意义重大。文章阐述了LEA电子枪工艺设计阶段MSA、Regression、ANOVA、SPC等质量工具的运用,并借助MINITAB软件的帮助,成功地实践了六西格玛DMAIC过程,找到了LEA电子枪G1/K、G1/G2间隙的工艺最佳设置,为新产品的开发成功及顺利量产奠定了基础。
【关键词】LEA电子枪、MSA、Regression、ANOVA、SPC、EKCO、8”EWT、40”EWT
【界定阶段】
(1) 项目背景
LEA电子枪是我公司自行开发的一个新产品。它具有兼容性强、装配简单、电特性优良等特点,因而成为目前显像管行业的主流产品。
(2) 项目主要任务
LEA电子枪工艺设计的主要任务是确定G1/K、G1/G2的最佳间隙。这两个参数对整管的EKCO(截止电压)等电特性参数有强相关关系。因此,通过各项试验来摸索G1/K、G1/G2与整管EKCO值之间的关系,并通过相关检测手段来保证批量生产时G1/K、G1/G2间隙处于受控范围是本项目的主要任务。
【测量阶段】
(1) G2/K气动量规的测量系统分析
G1/K间隙在对应工序制造时可通过模拟规设定最佳间隙值并通过气动量规的显示直观地反映出其间隙的实际值,一旦完成制造便无法再进行G1/K的复测;G1/G2间隙在对应工序制造时可通过塞片确定最佳间隙值,并可通过间隙规对实际间隙进行精确测定,但在实际大批量生产时无法对每一把枪进行精测(比较费时)。上述两个问题对G1/K、G1/G2间隙的控制带来很大困难。在实际生产中,我们通常对这两个间隙的控制采用G2/K间隙的测定来保证G1/K、G1/G2间隙的受控。G2/K表示G2零件至阴极的距离,可用下列函数式表示它们之间的关系:
G2/K=G1/K间隙+G1厚度+G1压印深度+G1/G2间隙+G2厚度
其中G1厚度、G1压印深度、G2厚度三个参数由零件来料决定(冲制件),实践证明其一致性好,因此G2/K的变化可直接反映出G1/K、G1/G2间隙的变化。G2/K的测量使用气动量规,在量产过程中我们对每一把电子枪均进行G2/K间隙全检。因此G2/K气动量规测量系统合格与否关系到G1/K、G1/G2间隙控制状况。
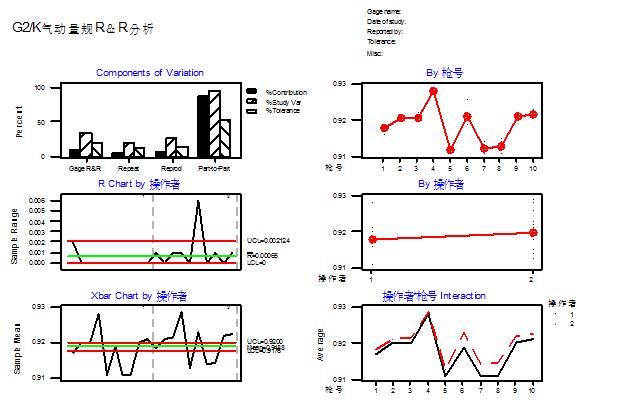
(2) G2/K气动量规测量系统R&R分析
图1 G2/K气动量规测量系统R&R分析
StdDev Study Var %Study Var %Tolerance
Source (SD) (5.15*SD) (%SV) (SV/Toler)
Total Gage R&R 1.79E-03 9.22E-03 33.04 18.44 (小于30%,该测量系统可以接受)
Repeatability 1.08E-03 5.55E-03 19.90 11.11
Reproducibility 1.43E-03 7.36E-03 26.38 14.72
Operater 1.43E-03 7.36E-03 26.38 14.72
Part-To-Part 5.11E-03 2.63E-02 94.38 52.68
Total Variation 5.42E-03 2.79E-02 100.00 55.81
G2/K气动量规测量系统R&R分析结果表明,该测量系统可接受。
【分析阶段】
(1) 由于各种电子枪在显像管中的工作原理相同,并且根据现有各品种电子枪的生产和质量分析经验,因此确定整管中EKCO(截止电压)、8”EWT(8”发射)和40”EWT(40”发射)等电特性参数与LEA电子枪G1/K、G1/G2间隙有强相关关系。
(2) 采用回归分析方法拟合8”EWT、40”EWT、EKCO与G1/K、G1/G2的回归方程
试验号 G1/K-G G1/G2-G 8"EWT-G 40"EWT-G EKCO-G
1 0.117 0.170 1590 1713 79.7
2 0.113 0.175 1547 1632 82.5
3 0.117 0.170 1503 1626 78.9
4 0.115 0.165 1635 1791 83.0
5 0.118 0.175 1468 1570 79.4
6 0.117 0.175 1551 1673 80.9
7 0.120 0.175 1422 1571 77.3
8 0.117 0.175 1527 1633 82.8
9 0.119 0.170 1505 1588 77.0
10 0.120 0.175 1442 1544 76.5
11 0.120 0.175 1486 1586 76.1
12 0.122 0.175 1300 1410 71.8
13 0.117 0.170 1548 1650 76.9
表 1 回归分析试验数据
 8”EWT与G1/K、G1/G2的回归分析
Regression Analysis: 8"EWT versus G1/K, G1/G2
The regression equation is
8"EWT = 5892 - 24132 G1/K - 8953 G1/G2
Predictor Coef SE Coef T P
Constant 5891.7 786.7 7.49 0.000
G1/K -24132 5813 -4.15 0.002
G1/G2 -8953 4182 -2.14 0.058
S = 44.31 R-Sq = 76.9% R-Sq(adj) = 72.2% (回归方程拟合良好)
Analysis of Variance
Source DF SS MS F P
Regression 2 65190 32595 16.60 0.001 (回归方程显著)
Residual Error 10 19636 1964
Total 12 84826
Source DF Seq SS
G1/K 1 56191
G1/G2 1 8999
Unusual Observations(异常观察值)
Obs G1/K 8"EWT Fit SE Fit Residual St Resid
12 0.122 1300.0 1380.9 25.5 -80.9 -2.24R
R denotes an observation with a large standardized residual
 40”EWT与G1/K、G1/G2的回归分析
Regression Analysis: 40"EWT versus G1/K, G1/G2
The regression equation is
40"EWT = 6363 - 22880 G1/K - 11883 G1/G2
Predictor Coef SE Coef T P
Constant 6362.7 893.9 7.12 0.000
G1/K -22880 6605 -3.46 0.006
G1/G2 -11883 4752 -2.50 0.031
S = 50.35 R-Sq = 74.3% R-Sq(adj) = 69.1% (回归方程拟合良好)
Analysis of Variance
Source DF SS MS F P
Regression 2 73139 36570 14.42 0.001 (回归方程显著)
Residual Error 10 25356 2536
Total 12 98495
Source DF Seq SS
G1/K 1 57287
G1/G2 1 15852
Unusual Observations(异常观察值)
Obs G1/K 40"EWT Fit SE Fit Residual St Resid
2 0.113 1632.0 1697.8 40.0 -65.8 -2.16R
R denotes an observation with a large standardized residual
 EKCO与G1/K、G1/G2的回归分析
Regression Analysis: EKCO versus G1/K, G1/G2
The regression equation is
EKCO = 208 - 1215 G1/K + 83 G1/G2
Predictor Coef SE Coef T P
Constant 207.63 30.56 6.79 0.000
G1/K -1215.4 225.8 -5.38 0.000
G1/G2 82.7 162.5 0.51 0.622
S = 1.721 R-Sq = 76.0% R-Sq(adj) = 71.2% (回归方程拟合良好)
Analysis of Variance
Source DF SS MS F P
Regression 2 93.774 46.887 15.82 0.001 (回归方程显著)
Residual Error 10 29.629 2.963
Total 12 123.403
Source DF Seq SS
G1/K 1 93.006
G1/G2 1 0.768
Unusual Observations(异常观察值)
Obs G1/K EKCO Fit SE Fit Residual St Resid
2 0.113 82.500 84.758 1.369 -2.258 -2.16R
R denotes an observation with a large standardized residual
(3) 结论
回归分析结果显示,回归方程拟合良好,但三个回归方程中均出现了异常观察值,这对回归方程的拟合性有一定的影响。在后续的工作中需要对回归方程的拟合性进行优化。
【改进阶段】
(1) 优化各参数回归方程的拟合程度
由于观察值“2”的试验结果在40”EWT和EKCO的回归方程中均出现了异常报警,说明该组试验数据的可靠性存在一些问题,我们决定将该组异常数据去除后重新拟合回归方程,结果如下:
 8”EWT与G1/K、G1/G2的回归分析
The regression equation is
8"EWT = 6410 - 37231 G1/K - 2952 G1/G2
Predictor Coef SE Coef T P
Constant 6409.9 700.7 9.15 0.000
G1/K -37231 7582 -4.91 0.001
G1/G2 -2952 4408 -0.67 0.520
S = 37.30 R-Sq = 84.8% R-Sq(adj) = 81.5% (回归方程拟合良好)
Analysis of Variance
Source DF SS MS F P
Regression 2 70097 35048 25.19 0.000 (回归方程良好)
Residual Error 9 12520 1391
Total 11 82617
Source DF Seq SS
G1/K 1 69473
G1/G2 1 624
 40”EWT与G1/K、G1/G2的回归分析
The regression equation is
40"EWT = 7030 - 39748 G1/K - 4156 G1/G2
Predictor Coef SE Coef T P
Constant 7030.0 729.1 9.64 0.000
G1/K -39748 7890 -5.04 0.001
G1/G2 -4156 4587 -0.91 0.389
S = 38.81 R-Sq = 86.2% R-Sq(adj) = 83.1% (回归方程拟合良好)
Analysis of Variance
Source DF SS MS F P
Regression 2 84602 42301 28.08 0.000 (回归方程显著)
Residual Error 9 13557 1506
Total 11 98159
Source DF Seq SS
G1/K 1 83365
G1/G2 1 1237
 EKCO与G1/K、G1/G2的回归分析
The regression equation is
EKCO = 231 - 1794 G1/K + 348 G1/G2
Predictor Coef SE Coef T P
Constant 230.51 24.86 9.27 0.000
G1/K -1793.8 269.0 -6.67 0.000
G1/G2 347.6 156.4 2.22 0.053
S = 1.323 R-Sq = 85.4% R-Sq(adj) = 82.1% (回归方程拟合良好)
Analysis of Variance
Source DF SS MS F P
Regression 2 91.813 45.907 26.22 0.000 (回归方程显著)
Residual Error 9 15.756 1.751
Total 11 107.569
Source DF Seq SS
G1/K 1 83.160
G1/G2 1 8.653
Unusual Observations
Obs G1/K EKCO Fit SE Fit Residual St Resid
12 0.117 76.900 79.731 0.490 -2.831 -2.30R
R denotes an observation with a large standardized residual
结论:异常观察值剔除后,回归方程拟合程度更加良好。
(2) 利用优化后的回归方程进行预测,并确定最佳G1/K、G1/G2间隙值
根据整管电特性的要求,EKCO最佳值为80V左右,8”EWT最佳值为1400~1500μA,40”EWT最佳值为1600μA左右。根据这些要求,我们利用回归方程对G1/K、G1/G2进行预测,结果如下:
序号 G1/K G1/G2 EKCO 8"EWT 40"EWT
1 0.110 0.160 89.3 1754 1993
2 0.110 0.165 91.1 1710 1972
3 0.110 0.170 92.8 1666 1951
4 0.110 0.175 94.6 1622 1930
5 0.110 0.180 96.3 1578 1910
6 0.112 0.160 85.8 1721 1913
7 0.112 0.165 87.5 1677 1892
8 0.112 0.170 89.2 1633 1872
9 0.112 0.175 91.0 1589 1851
10 0.112 0.180 92.7 1545 1830
11 0.114 0.160 82.2 1687 1834
12 0.114 0.165 83.9 1643 1813
13 0.114 0.170 85.6 1599 1792
14 0.114 0.175 87.4 1555 1771
15 0.114 0.180 89.1 1511 1751
16 0.116 0.160 78.6 1654 1754
17 0.116 0.165 80.3 1610 1733
18 0.116 0.170 82.1 1565 1713
19 0.116 0.175 83.8 1521 1692
20 0.116 0.180 85.5 1477 1671
21 0.118 0.160 75.0 1620 1675
22 0.118 0.165 76.7 1576 1654
23 0.118 0.170 78.5 1532 1633
24 0.118 0.175 80.2 1488 1612 (最佳值)
25 0.118 0.180 81.9 1444 1592
26 0.120 0.160 71.4 1586 1595
27 0.120 0.165 73.1 1542 1575
28 0.120 0.170 74.9 1498 1554
29 0.120 0.175 76.6 1454 1533
30 0.120 0.180 78.4 1410 1512
31 0.122 0.160 67.8 1553 1516
32 0.122 0.165 69.6 1509 1495
33 0.122 0.170 71.3 1465 1474
34 0.122 0.175 73.0 1421 1453
35 0.122 0.180 74.8 1377 1433
36 0.124 0.160 64.2 1519 1436
37 0.124 0.165 66.0 1475 1416
38 0.124 0.170 67.7 1431 1395
39 0.124 0.175 69.4 1387 1374
40 0.124 0.180 71.2 1343 1353
综合EKCO、8”EWT、40”EWT的预测结果,最终确定G1/K的最佳值为0.118、G1/G2最佳值为0.175。
(3) 对最佳工艺设定值的验证试验
根据回归方程的预测最佳值,我们再次进行了验证试验,确认试验结果符合最佳电特性的要求。数据如下:
序号 G1/K G1/G2 EKCO 8"EWT 40"EWT
1 0.117 0.170 80.1 1560 1680
2 0.118 0.175 79.9 1472 1596
3 0.118 0.170 78.8 1512 1613
4 0.116 0.175 83.5 1530 1678
5 0.119 0.175 78.1 1462 1581
6 0.118 0.175 80.4 1467 1592
7 0.119 0.180 80.2 1435 1577
8 0.118 0.170 78.5 1523 1621
9 0.117 0.175 82.2 1518 1639
在之后的小批量、中批量及大批量试验中电特性参数的各项抽查均达到要求。因此证明以G1/K 0.118为中心值、G1/G2间隙0.175为中心值进行工艺设置是符合最佳工艺要求的,并具备量产要求。
【控制阶段】
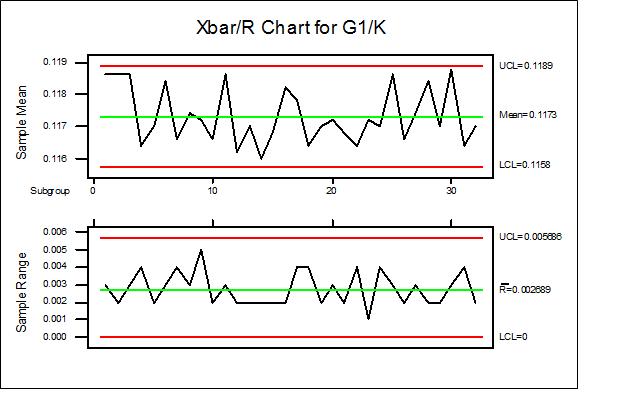
(1) 对G1/K间隙实施SPC控制
收集了一个月的G1/K间隙数据,用MINITAB对数据进行分析,确定了<X>-R图的控制线用于日常管理。
(2) 对G1/G2间隙实施抽样精测管理
在确定G1/G2间隙大小的压枪工序,我们规定每天批量生产前精测15把LEA电子枪的G1/G2间隙,根据测试数据对压枪塞片规格进行调整,确保G1/G2间隙符合最佳设置要求。
参考文献:
1.《六西格玛核心教程黑带读本》 中国标准出版社
2.《六西格玛成功实践实例荟萃》 中国标准出版社
MINITAB软件在LEA电子枪工艺设计中的应用
------上海永新彩色显像管股份有限公司 孙丽文
【摘要】
电子枪被称为显像管的心脏。LEA电子枪是我公司自行开发的一个新产品。而LEA电子枪的G1/K、G1/G2间隙设置对显像管的电特性,尤其是EKCO(截止电压)、8”EWT(8”发射)及40”EWT(40”发射)等电特性有直接影响。因此,确定LEA电子枪的工艺最佳G1/K、G1/G2间隙设置,对确定显像管的最佳电特性值意义重大。文章阐述了LEA电子枪工艺设计阶段MSA、Regression、ANOVA、SPC等质量工具的运用,并借助MINITAB软件的帮助,成功地实践了六西格玛DMAIC过程,找到了LEA电子枪G1/K、G1/G2间隙的工艺最佳设置,为新产品的开发成功及顺利量产奠定了基础。
【关键词】LEA电子枪、MSA、Regression、ANOVA、SPC、EKCO、8”EWT、40”EWT
【界定阶段】
(1) 项目背景
LEA电子枪是我公司自行开发的一个新产品。它具有兼容性强、装配简单、电特性优良等特点,因而成为目前显像管行业的主流产品。
(2) 项目主要任务
LEA电子枪工艺设计的主要任务是确定G1/K、G1/G2的最佳间隙。这两个参数对整管的EKCO(截止电压)等电特性参数有强相关关系。因此,通过各项试验来摸索G1/K、G1/G2与整管EKCO值之间的关系,并通过相关检测手段来保证批量生产时G1/K、G1/G2间隙处于受控范围是本项目的主要任务。
【测量阶段】
(1) G2/K气动量规的测量系统分析
G1/K间隙在对应工序制造时可通过模拟规设定最佳间隙值并通过气动量规的显示直观地反映出其间隙的实际值,一旦完成制造便无法再进行G1/K的复测;G1/G2间隙在对应工序制造时可通过塞片确定最佳间隙值,并可通过间隙规对实际间隙进行精确测定,但在实际大批量生产时无法对每一把枪进行精测(比较费时)。上述两个问题对G1/K、G1/G2间隙的控制带来很大困难。在实际生产中,我们通常对这两个间隙的控制采用G2/K间隙的测定来保证G1/K、G1/G2间隙的受控。G2/K表示G2零件至阴极的距离,可用下列函数式表示它们之间的关系:
G2/K=G1/K间隙+G1厚度+G1压印深度+G1/G2间隙+G2厚度
其中G1厚度、G1压印深度、G2厚度三个参数由零件来料决定(冲制件),实践证明其一致性好,因此G2/K的变化可直接反映出G1/K、G1/G2间隙的变化。G2/K的测量使用气动量规,在量产过程中我们对每一把电子枪均进行G2/K间隙全检。因此G2/K气动量规测量系统合格与否关系到G1/K、G1/G2间隙控制状况。
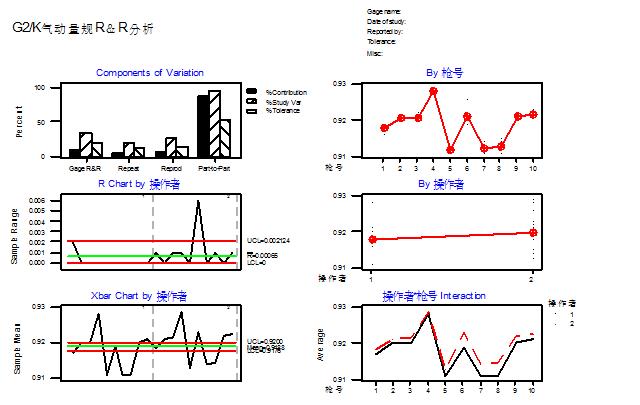
(2) G2/K气动量规测量系统R&R分析
图1 G2/K气动量规测量系统R&R分析
StdDev Study Var %Study Var %Tolerance
Source (SD) (5.15*SD) (%SV) (SV/Toler)
Total Gage R&R 1.79E-03 9.22E-03 33.04 18.44 (小于30%,该测量系统可以接受)
Repeatability 1.08E-03 5.55E-03 19.90 11.11
Reproducibility 1.43E-03 7.36E-03 26.38 14.72
Operater 1.43E-03 7.36E-03 26.38 14.72
Part-To-Part 5.11E-03 2.63E-02 94.38 52.68
Total Variation 5.42E-03 2.79E-02 100.00 55.81
G2/K气动量规测量系统R&R分析结果表明,该测量系统可接受。
【分析阶段】
(1) 由于各种电子枪在显像管中的工作原理相同,并且根据现有各品种电子枪的生产和质量分析经验,因此确定整管中EKCO(截止电压)、8”EWT(8”发射)和40”EWT(40”发射)等电特性参数与LEA电子枪G1/K、G1/G2间隙有强相关关系。
(2) 采用回归分析方法拟合8”EWT、40”EWT、EKCO与G1/K、G1/G2的回归方程
试验号 G1/K-G G1/G2-G 8"EWT-G 40"EWT-G EKCO-G
1 0.117 0.170 1590 1713 79.7
2 0.113 0.175 1547 1632 82.5
3 0.117 0.170 1503 1626 78.9
4 0.115 0.165 1635 1791 83.0
5 0.118 0.175 1468 1570 79.4
6 0.117 0.175 1551 1673 80.9
7 0.120 0.175 1422 1571 77.3
8 0.117 0.175 1527 1633 82.8
9 0.119 0.170 1505 1588 77.0
10 0.120 0.175 1442 1544 76.5
11 0.120 0.175 1486 1586 76.1
12 0.122 0.175 1300 1410 71.8
13 0.117 0.170 1548 1650 76.9
表 1 回归分析试验数据
 8”EWT与G1/K、G1/G2的回归分析
Regression Analysis: 8"EWT versus G1/K, G1/G2
The regression equation is
8"EWT = 5892 - 24132 G1/K - 8953 G1/G2
Predictor Coef SE Coef T P
Constant 5891.7 786.7 7.49 0.000
G1/K -24132 5813 -4.15 0.002
G1/G2 -8953 4182 -2.14 0.058
S = 44.31 R-Sq = 76.9% R-Sq(adj) = 72.2% (回归方程拟合良好)
Analysis of Variance
Source DF SS MS F P
Regression 2 65190 32595 16.60 0.001 (回归方程显著)
Residual Error 10 19636 1964
Total 12 84826
Source DF Seq SS
G1/K 1 56191
G1/G2 1 8999
Unusual Observations(异常观察值)
Obs G1/K 8"EWT Fit SE Fit Residual St Resid
12 0.122 1300.0 1380.9 25.5 -80.9 -2.24R
R denotes an observation with a large standardized residual
 40”EWT与G1/K、G1/G2的回归分析
Regression Analysis: 40"EWT versus G1/K, G1/G2
The regression equation is
40"EWT = 6363 - 22880 G1/K - 11883 G1/G2
Predictor Coef SE Coef T P
Constant 6362.7 893.9 7.12 0.000
G1/K -22880 6605 -3.46 0.006
G1/G2 -11883 4752 -2.50 0.031
S = 50.35 R-Sq = 74.3% R-Sq(adj) = 69.1% (回归方程拟合良好)
Analysis of Variance
Source DF SS MS F P
Regression 2 73139 36570 14.42 0.001 (回归方程显著)
Residual Error 10 25356 2536
Total 12 98495
Source DF Seq SS
G1/K 1 57287
G1/G2 1 15852
Unusual Observations(异常观察值)
Obs G1/K 40"EWT Fit SE Fit Residual St Resid
2 0.113 1632.0 1697.8 40.0 -65.8 -2.16R
R denotes an observation with a large standardized residual
 EKCO与G1/K、G1/G2的回归分析
Regression Analysis: EKCO versus G1/K, G1/G2
The regression equation is
EKCO = 208 - 1215 G1/K + 83 G1/G2
Predictor Coef SE Coef T P
Constant 207.63 30.56 6.79 0.000
G1/K -1215.4 225.8 -5.38 0.000
G1/G2 82.7 162.5 0.51 0.622
S = 1.721 R-Sq = 76.0% R-Sq(adj) = 71.2% (回归方程拟合良好)
Analysis of Variance
Source DF SS MS F P
Regression 2 93.774 46.887 15.82 0.001 (回归方程显著)
Residual Error 10 29.629 2.963
Total 12 123.403
Source DF Seq SS
G1/K 1 93.006
G1/G2 1 0.768
Unusual Observations(异常观察值)
Obs G1/K EKCO Fit SE Fit Residual St Resid
2 0.113 82.500 84.758 1.369 -2.258 -2.16R
R denotes an observation with a large standardized residual
(3) 结论
回归分析结果显示,回归方程拟合良好,但三个回归方程中均出现了异常观察值,这对回归方程的拟合性有一定的影响。在后续的工作中需要对回归方程的拟合性进行优化。
【改进阶段】
(1) 优化各参数回归方程的拟合程度
由于观察值“2”的试验结果在40”EWT和EKCO的回归方程中均出现了异常报警,说明该组试验数据的可靠性存在一些问题,我们决定将该组异常数据去除后重新拟合回归方程,结果如下:
 8”EWT与G1/K、G1/G2的回归分析
The regression equation is
8"EWT = 6410 - 37231 G1/K - 2952 G1/G2
Predictor Coef SE Coef T P
Constant 6409.9 700.7 9.15 0.000
G1/K -37231 7582 -4.91 0.001
G1/G2 -2952 4408 -0.67 0.520
S = 37.30 R-Sq = 84.8% R-Sq(adj) = 81.5% (回归方程拟合良好)
Analysis of Variance
Source DF SS MS F P
Regression 2 70097 35048 25.19 0.000 (回归方程良好)
Residual Error 9 12520 1391
Total 11 82617
Source DF Seq SS
G1/K 1 69473
G1/G2 1 624
 40”EWT与G1/K、G1/G2的回归分析
The regression equation is
40"EWT = 7030 - 39748 G1/K - 4156 G1/G2
Predictor Coef SE Coef T P
Constant 7030.0 729.1 9.64 0.000
G1/K -39748 7890 -5.04 0.001
G1/G2 -4156 4587 -0.91 0.389
S = 38.81 R-Sq = 86.2% R-Sq(adj) = 83.1% (回归方程拟合良好)
Analysis of Variance
Source DF SS MS F P
Regression 2 84602 42301 28.08 0.000 (回归方程显著)
Residual Error 9 13557 1506
Total 11 98159
Source DF Seq SS
G1/K 1 83365
G1/G2 1 1237
 EKCO与G1/K、G1/G2的回归分析
The regression equation is
EKCO = 231 - 1794 G1/K + 348 G1/G2
Predictor Coef SE Coef T P
Constant 230.51 24.86 9.27 0.000
G1/K -1793.8 269.0 -6.67 0.000
G1/G2 347.6 156.4 2.22 0.053
S = 1.323 R-Sq = 85.4% R-Sq(adj) = 82.1% (回归方程拟合良好)
Analysis of Variance
Source DF SS MS F P
Regression 2 91.813 45.907 26.22 0.000 (回归方程显著)
Residual Error 9 15.756 1.751
Total 11 107.569
Source DF Seq SS
G1/K 1 83.160
G1/G2 1 8.653
Unusual Observations
Obs G1/K EKCO Fit SE Fit Residual St Resid
12 0.117 76.900 79.731 0.490 -2.831 -2.30R
R denotes an observation with a large standardized residual
结论:异常观察值剔除后,回归方程拟合程度更加良好。
(2) 利用优化后的回归方程进行预测,并确定最佳G1/K、G1/G2间隙值
根据整管电特性的要求,EKCO最佳值为80V左右,8”EWT最佳值为1400~1500μA,40”EWT最佳值为1600μA左右。根据这些要求,我们利用回归方程对G1/K、G1/G2进行预测,结果如下:
序号 G1/K G1/G2 EKCO 8"EWT 40"EWT
1 0.110 0.160 89.3 1754 1993
2 0.110 0.165 91.1 1710 1972
3 0.110 0.170 92.8 1666 1951
4 0.110 0.175 94.6 1622 1930
5 0.110 0.180 96.3 1578 1910
6 0.112 0.160 85.8 1721 1913
7 0.112 0.165 87.5 1677 1892
8 0.112 0.170 89.2 1633 1872
9 0.112 0.175 91.0 1589 1851
10 0.112 0.180 92.7 1545 1830
11 0.114 0.160 82.2 1687 1834
12 0.114 0.165 83.9 1643 1813
13 0.114 0.170 85.6 1599 1792
14 0.114 0.175 87.4 1555 1771
15 0.114 0.180 89.1 1511 1751
16 0.116 0.160 78.6 1654 1754
17 0.116 0.165 80.3 1610 1733
18 0.116 0.170 82.1 1565 1713
19 0.116 0.175 83.8 1521 1692
20 0.116 0.180 85.5 1477 1671
21 0.118 0.160 75.0 1620 1675
22 0.118 0.165 76.7 1576 1654
23 0.118 0.170 78.5 1532 1633
24 0.118 0.175 80.2 1488 1612 (最佳值)
25 0.118 0.180 81.9 1444 1592
26 0.120 0.160 71.4 1586 1595
27 0.120 0.165 73.1 1542 1575
28 0.120 0.170 74.9 1498 1554
29 0.120 0.175 76.6 1454 1533
30 0.120 0.180 78.4 1410 1512
31 0.122 0.160 67.8 1553 1516
32 0.122 0.165 69.6 1509 1495
33 0.122 0.170 71.3 1465 1474
34 0.122 0.175 73.0 1421 1453
35 0.122 0.180 74.8 1377 1433
36 0.124 0.160 64.2 1519 1436
37 0.124 0.165 66.0 1475 1416
38 0.124 0.170 67.7 1431 1395
39 0.124 0.175 69.4 1387 1374
40 0.124 0.180 71.2 1343 1353
综合EKCO、8”EWT、40”EWT的预测结果,最终确定G1/K的最佳值为0.118、G1/G2最佳值为0.175。
(3) 对最佳工艺设定值的验证试验
根据回归方程的预测最佳值,我们再次进行了验证试验,确认试验结果符合最佳电特性的要求。数据如下:
序号 G1/K G1/G2 EKCO 8"EWT 40"EWT
1 0.117 0.170 80.1 1560 1680
2 0.118 0.175 79.9 1472 1596
3 0.118 0.170 78.8 1512 1613
4 0.116 0.175 83.5 1530 1678
5 0.119 0.175 78.1 1462 1581
6 0.118 0.175 80.4 1467 1592
7 0.119 0.180 80.2 1435 1577
8 0.118 0.170 78.5 1523 1621
9 0.117 0.175 82.2 1518 1639
在之后的小批量、中批量及大批量试验中电特性参数的各项抽查均达到要求。因此证明以G1/K 0.118为中心值、G1/G2间隙0.175为中心值进行工艺设置是符合最佳工艺要求的,并具备量产要求。
【控制阶段】
(1) 对G1/K间隙实施SPC控制
收集了一个月的G1/K间隙数据,用MINITAB对数据进行分析,确定了<X>-R图的控制线用于日常管理。
(2) 对G1/G2间隙实施抽样精测管理
在确定G1/G2间隙大小的压枪工序,我们规定每天批量生产前精测15把LEA电子枪的G1/G2间隙,根据测试数据对压枪塞片规格进行调整,确保G1/G2间隙符合最佳设置要求。
参考文献:
1.《六西格玛核心教程黑带读本》 中国标准出版社
2.《六西格玛成功实践实例荟萃》 中国标准出版社


{V 看了一下本帖有20次点检记录,但是没有回复,我觉得有点可惜,不知道楼主有没有曲高和寡和知音难寻的感觉呢!说实话这个帖子是有点太深奥,发在新手课堂里面有点可惜了,多数人应该不会体会其精髓的!
代表来到过这里却没有留下足迹的朋友们感谢你吧!!{V {V {V
代表来到过这里却没有留下足迹的朋友们感谢你吧!!{V {V {V
2008-11-12 15:58
本问题共 8 个回答,登录后查看全部
登录查看
相关问题
电子枪零件现有材质改为较便宜材质专案分享
7 回答 · 2397 浏览
DOE 实验设计实战应用
2 回答 · 11439 浏览
EHS法律法规实战应用及企业关注点
0 回答 · 3491 浏览
Minitab软件炒股时应用
21 回答 · 4948 浏览
过程能力分析在检验质控中应用前景暨MINITAB_软件能力分析操作演示
3 回答 · 2925 浏览
求教minitab统计软件的应用
1 回答 · 2128 浏览
minitab软件的应用
4 回答 · 2119 浏览
关于FMEA在软件企业的应用讨论
11 回答 · 4162 浏览
软件企业如何应用ISO9001?
3 回答 · 2103 浏览
标准如何在软件企业中应用
1 回答 · 2036 浏览