
【校稿】 第二十五篇 Don’t accept ambiguity; insist on ‘absolute’ information
本帖最后由 小编H 于 2011-8-10 11:14 编辑
**Don’t accept ambiguity; insist on ‘absolute’ information
拒绝含糊,坚持完整信息。**
by Christine M. Anderson-Cook作者:克里斯廷M安德森-库克
We live in an age in which media and marketing often spin data and end up misleading and misinforming the consumer. 我们生活在一个媒体与市场营销的年代,经常会有一些编造出数据来误导消费者或者将错误的信息传达给消费者。Consider these recent headlines that left some obvious questions unanswered: 为了对应以下这些标题,标题后留下了一些很明显的疑问:
• "Foreclosure auctions drop more than 30%." From when to when? What is the rate now? Is this usually a volatile rate that naturally fluctuates quite a bit? “赎回权的拍卖价格跌幅大于30%。”从什么时候到什么时候?现在价格是多少?它通常是一个受影响比较大的数值吗?
• "South Carolina’s unemployment rate shot from 5.5% in February 2008 to 12.5% last January." The accompanying article described how the rate fluctuated in 2010 and was 10.7% in November. Why was this window of time selected? “2008年2月,南卡罗来纳的失业率为5.5%,并于来年的1月飙升至12.5%。”这篇文章随后描述到该比率在2010年是如何变化的,并且在11月份曾达到10.7%。那么为什么选择这个时间段?
A lot of advertisers and news outlets seek to sensationalize their messages to catch our attention. 很多广告客户以及新闻爆料者在寻找一种以耸人听闻的手法去处理他们发布的信息,以吸引大家的眼球。Often, the way information is communicated in the workplace seems to have borrowed from media and marketing’s approach. 而这种信息通常是在媒体或者销售渠道中传播。
Recently, I have been resensitized to these misleading practices of data presentation by reading books by Gerd Gigerenzer1 and Donald J. Wheeler.2 最近我读了Gerd Gigerenzer 和Donald J. Wheele的书,重温了这些由数据表达而导致误导的实例。Both authors highlight the importance of presenting data in a non-deceptive format, which refrains from prejudicing the audience, giving sufficient information for the assessment or decision to be made independently.两位作者都强调了以一种不欺骗人的方式展示数据的重要性,克制以避免让读者产生偏见,并为读者独立决定或者评估提供充分的信息。
Their ideas build on the work of Edward Tufte.3–6 Key messages are:他们的观点是建立在爱德华塔夫特的工作基础之上的。重要观点有:
Consider the following three examples of deceptive or ambiguous statements that illustrate how we might adapt from soundbites and headlines to refocus data presentation to be maximally informative and minimally deceptive:以下有三个具有欺骗性的或者说是不明确的陈述,并举例说明我们怎样根据标题或者是只言片语改编数据,以致使数据展示全面性的最大化以及欺骗性的最小化。
‘Production is up 10%’ 生产提高10%
This sounds catchy and impressive, but should this result get you excited?这听起来容易使人上当并且给人印象深刻,可是这结果会让你感到兴奋吗? Gigerenzer highlights how the human mind is naturally predisposed to filling in missing information to give the statement context to make it understandable. Gigerenzer指出人们通常天生倾向用上下文来补充说明缺失信息,使其比较容易理解。 Without additional details, you are unable to know if this is an important fact. 如果没有附加的详细说明,你将很难理解它,即便这是一条重要的事实。
What other key information should be provided for you to make an enlightened assessment of this statement? 为了评估这条陈述,你还需要哪些其他的重要信息吗?
First, you need to know the comparative time period you are relating this interval to: Are you looking at this month’s production compared with last month? 首先,你需要了解与其相关联的时间段来进行比较:你看过这个月的生产与上个月的生产进行比较吗?Compared with this month last year? 与去年的这个月进行比较了吗?Compared with average production in this month for the last 10 years?与过去10个月的平均水平进行比较了吗?
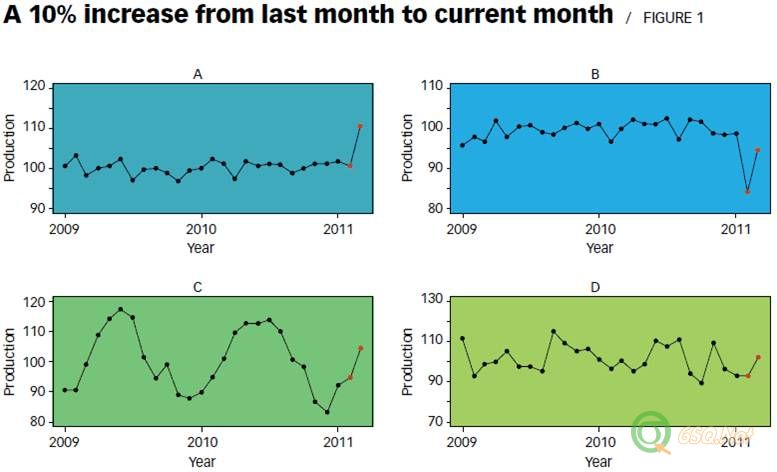
Second, when the comparison is based on a single previous time period, it is helpful to acknowledge the natural variation between observations.然后,当与以前的某一段时间比较过后,这将有利于我们了解观察体之间的本身变异。 Figure 1 shows four different plots with a 10% change in production from the last month to this month.图1展示了4组不同趋势,都是与上个月进行比较后,发现生产有了10%的变化。
Figure 1
In all cases except the first situation (A), we are unlikely to think this change is indicative of real change in production.不论怎么样,除了第一种情况(如A图),我们不可能认为这种变化是真正的生产变化。 If last month’s observation represented a 13% drop in production from the previous month (B), then you are likely to be less impressed with this month’s increase.如果上个月生产数据比早前的一个月减少了13%(如B图),然后你就很可能对这个月的增长印象不是很深刻。
Similarly, if there is a seasonal trend (C), the increase in production might coincide with the regular annual pattern, and you would likely be better informed by looking at production compared to the average for this month in other years.同样,对于季节性趋势(如C图),生产的增长就可能是符合规律的年度变化趋势,然后你就会拿这个月的生产数据与去年的这个月的数据做比较。 Finally, (D) shows a high variability process in which fluctuations of 10% are not unexpected, and you should likely react only when the change falls outside the range of the natural variation of the process. 最后,如D图,相对于波动10%来说,过程本身的变异比较大,下个月的趋势难以预测。那么,只有变化大于过程本身的变异范围时,你才可以发现。
Your interpretation of the 10% change is very much a function of understanding the pattern of change in recent times.对于10%变化的解释有很多,可以帮助我们理解现在变化的意义。 To assess the importance of this change, it would be ideal for the comparison to be made relative to similar months of data (for instance, the average of months with similar seasonal patterns for several years) and with the associated uncertainty of production appropriately characterized. 为了评估这个变化,比较类似月份的数据以及相关生产数据就比较理想(举个例子,比较几年中类似季节月份的平均值)。
Also, a simple time series plot with enumerated scale shown on the y-axis—and with sufficient history to capture seasonality—is an effective summary to provide a compact and suitable context for interpretation. 同时,一个简单时间序列图拥有充分的历史信息用来捕捉周期性的变化,也是一种有效地工具来提供既简洁又恰当的上下文解释。The inclusion of the actual production numbers and recent history fills in the necessary details, and allows the audience to decide for itself if the change should be considered unusual and important.填入实际的生产数据和近来的历史数据后,让读者自己决定该变化是否是不平常的或是有重要意义的。
‘Defect rate doubled last quarter’上个季度不良率翻倍了。
Defect rates are typically estimated by sampling from production throughout the time interval.不良率是按照一定的时间段从生产抽样而得到的。 The defect rate change is given relative to a previous time period, but because defect rates across different production environments vary considerably, it is more critical to understand the true defect rates to assess the practical importance of this change.不良率的变化是相对于前一段时间而言的。由于不良率会因为不同的生产环境变化而变化,所以理解真正的不良率去评价这个变化的实际意义尤为重要。
If your focus is on the yield of the process, a defect rate change from one in 50 to two in 50 might have a much higher impact than a defect rate change from one in 100,000 to two in 100,000. 如果你关注的是过程的良率,从50个中有一个不良到50个中有两个不良的变化显然大于从100,000中有一个不良到100,000中有两个不良的变化。If your focus is on safety, any change in defect rate might be considered quite important.如果你关注的是安全问题,不良率可能只是会被考虑一下而已。
Depending on the sampling rate and the cost of testing, the uncertainty associated with the estimates of defect rates can vary substantially.受抽检比率和测试成本的影响,不良率评估的不确定一直存在。 If the point estimate for defect rate doubled but remained within a 95% uncertainty interval for the rate (for instance, 0.002 +/– 0.002 for the previous quarter to 0.004 +/– 0.0025 for the current quarter), it is possible the nature of the sampling procedure might explain a large portion of the observed change. 如果不良率的估计变异翻倍,但还在95%的不确定区间内(比如,前一个季度估计变异为0.002+/-0.002,这个季度变化为0.004+/-0.0025),在这种情况下,抽样本身变异就占观察到的总变异的一大部分。
But if the associated uncertainty is much smaller (for instance, 0.002 +/– 0.0005 for the previous quarter to 0.004 +/– 0.0005 for the current quarter), the observed change in rates is unlikely to be explained by the sampling process and likely is due to a real change in the defect rate.但是如果与抽样相关的不确定非常小(例如,前一个季度估计变异为0.002+/-0.0005,这个季度估计变异为0.004+/-0.0005。),抽样过程就不可能会影响观察到的变异,而很可能是过程中真正的不良率变化。 It is also important, however, to consider the practical importance of the observed change.从而可以考虑到观察值的变异的实际意义,这一点很重要。
To clear up this case, show the absolute defect rate with the associated uncertainty of the estimate for the comparison quarter and the new quarter.抛开这个案例,我们可以比较这个季度和下个季度的绝对不良率,即使它存在估计的不确定。 This helps to calibrate the absolute change and the importance of the change given the intended use of the parts. 但这可以帮助我们去校对不良率的绝对变化,或者是校对我们刻意造出来的变化。
In addition, a summary plot of recent trends in the defect rate using a time series plot with included uncertainty will help assess the longer–term trend, as well as the natural fluctuations in estimates given the sampling and testing procedure.另外,可以用时间序列图来总结近来不良率的趋势(包含那些不确定的变异),这样一来就可以分析出它长期的趋势,同时也看出由抽样和测试程序而估计出来的自然波动。
‘A 10% temperature increase gave a 15% yield increase’温度升高了10%,从而良率提供了15%。
The final example illustrates the importance of understanding units and how reporting the absolute numbers, rather then relative change, can improve interpretability.最后这个例子说明理解单位的重要性,并且阐述怎么尽量用相关的变化来取代一些绝对的数字来进行报告,这样可以使报告更具有说服力。 The data that led to this headline originated from a laboratory study in which different production environments were considered. 标题中的数据是来源于一个实验室研究,这项研究也考虑了不同的生产环境。
The default production temperature was 100°F, and it was found that a change to 110°F (the 10% increase) produced the observed increase in yield from 72% to 82.8%.默认的生产温度是100华氏度,并且发现提高温度至110华氏度(提高10%)可导致良率从72%提高到82.8%。
Given the actual numbers, you could formulate a number of alternative headlines, which all appear to characterize the results but are similarly lacking in real information.拿到这些真实数据后,你可以提炼出很多标题来展示这个结果,可是你会发现这些标题都不能表达出最真实且全面的信息。 You could use degrees Celsius (100°F = 37.8°C and 110°F = 43.3°C, giving a 14.6% increase) or report the defect rate (72% yield↔28% defect rate and 82.8% yield↔17.2% defect rate, giving a 38.6% reduction in defects). 你可以使用摄氏度(100华氏度=37.8摄氏度,110华氏度=43.3摄氏度,结果是提高14.6%。)或者以不良率来报告(72%的良率=28%的不良率,82.8%的良率=17.2%的不良率,结果是不良率减少38.6%。)。
Hence, the same absolute results could translate into any of the following misleading or incomplete headlines:因此,同样结果可以得出以下任意一个误导或者是不完全的标题:
• A 14.6% increase in temperature (C) gave a 15% increase in yield. 温度(摄氏度)提高了14.6%,可以使良率提高15%。
• A 10% increase in temperature (F) gave a 38.6% reduction in defects. 温度(华氏度)提高10%,可以使不良率减少38.6%。
• A 14.6% increase in temperature (C) gave a 38.6% reduction in defects, in addition to the original option. 温度(摄氏度)提高14.6%,可以使不良率减少38.6%。
Clearly, the percentage changes are highly dependent on the summary chosen and give different impressions of the study’s results.很明显,总结方式的不同决定着百分比变化的不同,用不同的总结方式来表达同一研究结果也给大家带来不同的印象。 There are several other important errors in this headline. 同时,在这个标题中也存在着其他重要的错误。
First, the percentage increase of temperature is actually meaningless. 首先,温度增加的百分比是没有实际意义的。Percentages assume the zero on the scale corresponds to something absolute.百分比是假定从刻度0开始对应的绝对值。Here, 0°C or 0°F are relatively arbitrary and do not represent a starting point for the scale against which percentage changes can be sensibly measured.而这里的0摄氏度或者0华氏度是任意的,不代表温度刻度的起点,所以百分比变化差异这么大。
Perhaps even more misleading is the idea that a temperature change is in any way comparable to a change in yield.可能有甚至更多误导的想法,要将温度的变化以任何一种方式去跟良率的变化去做比较。 It might make sense to compare a change in input costs of production (how much does it cost to raise the temperature from 100°F to 110°F) against change in output yield, but the headline is a classic apples–to–oranges comparison that lacks intrinsic meaning.比较生产投入的成本增加(将温度从100华氏度提高到110华氏度需要增加多少成本。)与良率的变化可能会比较有意义一点,可是像上面的标题一样,就是典型的拿苹果和橙子做比较,实在是没有内在意义。
Complete and self contained完整全面
There is no substitute for providing complete information on the absolute scale—it allows the audience to directly assess the context and importance of the information.只有提供完整的信息,才能让读者直接评价上下文的关系以及信息的重要性。 Providing a graphical or numerical summary of recent history is also valuable for enhancing the context and incorporating a measure of natural variation.那么,图表化的或者是数字化的总结也是一种加强上下文联系和表现本身变异的方式。When the quantities of interest are obtained by estimation, the uncertainty associated with this should be included as well. 当通过估计而了解了感兴趣的问题时,相关的不确定的变异也包含在内。
While the catchy headlines and relative summaries have the opportunity to be attention–grabbers, statisticians and those who report data–based results should resist these tactics and provide a complete self–contained summary that includes all of the key information from which to make an informed decision. 虽然容易让人上当的标题和有关联的总结都有机会引起大家的注意,可是数据采集者,统计人员以及那些报告数据的人们,都应该能抵抗这些欺骗策略,从而根据数据结果提供一个全面完整的总结,其中包括所有的关键信息,以致可以做出一个周全的决定。
Christine M Anderson-Cook is a research scientist at Los Alamos National Laboratory in Los Alamos, NM. She earned a doctorate in statistics from the University of Waterloo in Ontario. Anderson-Cook is a fellow of the American Statistical Association and a senior member of ASQ.克里斯廷M安德森-库克是美国新墨西哥州洛斯阿拉莫斯洛杉矶国家实验室的研究员。她在美国衣安大略湖沃特卢大学获得统计学博士头衔。安德森-库克是美国统计协会的特别成员,同时也是美国质量协会的资深成员。
**Don’t accept ambiguity; insist on ‘absolute’ information
拒绝含糊,坚持完整信息。**
by Christine M. Anderson-Cook作者:克里斯廷M安德森-库克
We live in an age in which media and marketing often spin data and end up misleading and misinforming the consumer. 我们生活在一个媒体与市场营销的年代,经常会有一些编造出数据来误导消费者或者将错误的信息传达给消费者。Consider these recent headlines that left some obvious questions unanswered: 为了对应以下这些标题,标题后留下了一些很明显的疑问:
• "Foreclosure auctions drop more than 30%." From when to when? What is the rate now? Is this usually a volatile rate that naturally fluctuates quite a bit? “赎回权的拍卖价格跌幅大于30%。”从什么时候到什么时候?现在价格是多少?它通常是一个受影响比较大的数值吗?
• "South Carolina’s unemployment rate shot from 5.5% in February 2008 to 12.5% last January." The accompanying article described how the rate fluctuated in 2010 and was 10.7% in November. Why was this window of time selected? “2008年2月,南卡罗来纳的失业率为5.5%,并于来年的1月飙升至12.5%。”这篇文章随后描述到该比率在2010年是如何变化的,并且在11月份曾达到10.7%。那么为什么选择这个时间段?
A lot of advertisers and news outlets seek to sensationalize their messages to catch our attention. 很多广告客户以及新闻爆料者在寻找一种以耸人听闻的手法去处理他们发布的信息,以吸引大家的眼球。Often, the way information is communicated in the workplace seems to have borrowed from media and marketing’s approach. 而这种信息通常是在媒体或者销售渠道中传播。
Recently, I have been resensitized to these misleading practices of data presentation by reading books by Gerd Gigerenzer1 and Donald J. Wheeler.2 最近我读了Gerd Gigerenzer 和Donald J. Wheele的书,重温了这些由数据表达而导致误导的实例。Both authors highlight the importance of presenting data in a non-deceptive format, which refrains from prejudicing the audience, giving sufficient information for the assessment or decision to be made independently.两位作者都强调了以一种不欺骗人的方式展示数据的重要性,克制以避免让读者产生偏见,并为读者独立决定或者评估提供充分的信息。
Their ideas build on the work of Edward Tufte.3–6 Key messages are:他们的观点是建立在爱德华塔夫特的工作基础之上的。重要观点有:
- Give the raw data in its natural form (absolute summaries), which is strongly preferred to relative comparisons from one observation to another. 获得原始数据,最好能在两个不同的观察体之间做一些相关的比较。
- Provide sufficient historical data to allow realistic evaluation of the recent changes, taking into account natural fluctuation and previous trends. 提供充分的历史数据,以评估现在的变化,重视本身的波动以及早前的趋势。
- Include a quantification of measurement uncertainty with the point estimate if there is uncertainty with an estimated quantity. 如果估计数量的不确定,还须包括测量不确定的量化。
Consider the following three examples of deceptive or ambiguous statements that illustrate how we might adapt from soundbites and headlines to refocus data presentation to be maximally informative and minimally deceptive:以下有三个具有欺骗性的或者说是不明确的陈述,并举例说明我们怎样根据标题或者是只言片语改编数据,以致使数据展示全面性的最大化以及欺骗性的最小化。
‘Production is up 10%’ 生产提高10%
This sounds catchy and impressive, but should this result get you excited?这听起来容易使人上当并且给人印象深刻,可是这结果会让你感到兴奋吗? Gigerenzer highlights how the human mind is naturally predisposed to filling in missing information to give the statement context to make it understandable. Gigerenzer指出人们通常天生倾向用上下文来补充说明缺失信息,使其比较容易理解。 Without additional details, you are unable to know if this is an important fact. 如果没有附加的详细说明,你将很难理解它,即便这是一条重要的事实。
What other key information should be provided for you to make an enlightened assessment of this statement? 为了评估这条陈述,你还需要哪些其他的重要信息吗?
First, you need to know the comparative time period you are relating this interval to: Are you looking at this month’s production compared with last month? 首先,你需要了解与其相关联的时间段来进行比较:你看过这个月的生产与上个月的生产进行比较吗?Compared with this month last year? 与去年的这个月进行比较了吗?Compared with average production in this month for the last 10 years?与过去10个月的平均水平进行比较了吗?
Second, when the comparison is based on a single previous time period, it is helpful to acknowledge the natural variation between observations.然后,当与以前的某一段时间比较过后,这将有利于我们了解观察体之间的本身变异。 Figure 1 shows four different plots with a 10% change in production from the last month to this month.图1展示了4组不同趋势,都是与上个月进行比较后,发现生产有了10%的变化。
Figure 1
In all cases except the first situation (A), we are unlikely to think this change is indicative of real change in production.不论怎么样,除了第一种情况(如A图),我们不可能认为这种变化是真正的生产变化。 If last month’s observation represented a 13% drop in production from the previous month (B), then you are likely to be less impressed with this month’s increase.如果上个月生产数据比早前的一个月减少了13%(如B图),然后你就很可能对这个月的增长印象不是很深刻。
Similarly, if there is a seasonal trend (C), the increase in production might coincide with the regular annual pattern, and you would likely be better informed by looking at production compared to the average for this month in other years.同样,对于季节性趋势(如C图),生产的增长就可能是符合规律的年度变化趋势,然后你就会拿这个月的生产数据与去年的这个月的数据做比较。 Finally, (D) shows a high variability process in which fluctuations of 10% are not unexpected, and you should likely react only when the change falls outside the range of the natural variation of the process. 最后,如D图,相对于波动10%来说,过程本身的变异比较大,下个月的趋势难以预测。那么,只有变化大于过程本身的变异范围时,你才可以发现。
Your interpretation of the 10% change is very much a function of understanding the pattern of change in recent times.对于10%变化的解释有很多,可以帮助我们理解现在变化的意义。 To assess the importance of this change, it would be ideal for the comparison to be made relative to similar months of data (for instance, the average of months with similar seasonal patterns for several years) and with the associated uncertainty of production appropriately characterized. 为了评估这个变化,比较类似月份的数据以及相关生产数据就比较理想(举个例子,比较几年中类似季节月份的平均值)。
Also, a simple time series plot with enumerated scale shown on the y-axis—and with sufficient history to capture seasonality—is an effective summary to provide a compact and suitable context for interpretation. 同时,一个简单时间序列图拥有充分的历史信息用来捕捉周期性的变化,也是一种有效地工具来提供既简洁又恰当的上下文解释。The inclusion of the actual production numbers and recent history fills in the necessary details, and allows the audience to decide for itself if the change should be considered unusual and important.填入实际的生产数据和近来的历史数据后,让读者自己决定该变化是否是不平常的或是有重要意义的。
‘Defect rate doubled last quarter’上个季度不良率翻倍了。
Defect rates are typically estimated by sampling from production throughout the time interval.不良率是按照一定的时间段从生产抽样而得到的。 The defect rate change is given relative to a previous time period, but because defect rates across different production environments vary considerably, it is more critical to understand the true defect rates to assess the practical importance of this change.不良率的变化是相对于前一段时间而言的。由于不良率会因为不同的生产环境变化而变化,所以理解真正的不良率去评价这个变化的实际意义尤为重要。
If your focus is on the yield of the process, a defect rate change from one in 50 to two in 50 might have a much higher impact than a defect rate change from one in 100,000 to two in 100,000. 如果你关注的是过程的良率,从50个中有一个不良到50个中有两个不良的变化显然大于从100,000中有一个不良到100,000中有两个不良的变化。If your focus is on safety, any change in defect rate might be considered quite important.如果你关注的是安全问题,不良率可能只是会被考虑一下而已。
Depending on the sampling rate and the cost of testing, the uncertainty associated with the estimates of defect rates can vary substantially.受抽检比率和测试成本的影响,不良率评估的不确定一直存在。 If the point estimate for defect rate doubled but remained within a 95% uncertainty interval for the rate (for instance, 0.002 +/– 0.002 for the previous quarter to 0.004 +/– 0.0025 for the current quarter), it is possible the nature of the sampling procedure might explain a large portion of the observed change. 如果不良率的估计变异翻倍,但还在95%的不确定区间内(比如,前一个季度估计变异为0.002+/-0.002,这个季度变化为0.004+/-0.0025),在这种情况下,抽样本身变异就占观察到的总变异的一大部分。
But if the associated uncertainty is much smaller (for instance, 0.002 +/– 0.0005 for the previous quarter to 0.004 +/– 0.0005 for the current quarter), the observed change in rates is unlikely to be explained by the sampling process and likely is due to a real change in the defect rate.但是如果与抽样相关的不确定非常小(例如,前一个季度估计变异为0.002+/-0.0005,这个季度估计变异为0.004+/-0.0005。),抽样过程就不可能会影响观察到的变异,而很可能是过程中真正的不良率变化。 It is also important, however, to consider the practical importance of the observed change.从而可以考虑到观察值的变异的实际意义,这一点很重要。
To clear up this case, show the absolute defect rate with the associated uncertainty of the estimate for the comparison quarter and the new quarter.抛开这个案例,我们可以比较这个季度和下个季度的绝对不良率,即使它存在估计的不确定。 This helps to calibrate the absolute change and the importance of the change given the intended use of the parts. 但这可以帮助我们去校对不良率的绝对变化,或者是校对我们刻意造出来的变化。
In addition, a summary plot of recent trends in the defect rate using a time series plot with included uncertainty will help assess the longer–term trend, as well as the natural fluctuations in estimates given the sampling and testing procedure.另外,可以用时间序列图来总结近来不良率的趋势(包含那些不确定的变异),这样一来就可以分析出它长期的趋势,同时也看出由抽样和测试程序而估计出来的自然波动。
‘A 10% temperature increase gave a 15% yield increase’温度升高了10%,从而良率提供了15%。
The final example illustrates the importance of understanding units and how reporting the absolute numbers, rather then relative change, can improve interpretability.最后这个例子说明理解单位的重要性,并且阐述怎么尽量用相关的变化来取代一些绝对的数字来进行报告,这样可以使报告更具有说服力。 The data that led to this headline originated from a laboratory study in which different production environments were considered. 标题中的数据是来源于一个实验室研究,这项研究也考虑了不同的生产环境。
The default production temperature was 100°F, and it was found that a change to 110°F (the 10% increase) produced the observed increase in yield from 72% to 82.8%.默认的生产温度是100华氏度,并且发现提高温度至110华氏度(提高10%)可导致良率从72%提高到82.8%。
Given the actual numbers, you could formulate a number of alternative headlines, which all appear to characterize the results but are similarly lacking in real information.拿到这些真实数据后,你可以提炼出很多标题来展示这个结果,可是你会发现这些标题都不能表达出最真实且全面的信息。 You could use degrees Celsius (100°F = 37.8°C and 110°F = 43.3°C, giving a 14.6% increase) or report the defect rate (72% yield↔28% defect rate and 82.8% yield↔17.2% defect rate, giving a 38.6% reduction in defects). 你可以使用摄氏度(100华氏度=37.8摄氏度,110华氏度=43.3摄氏度,结果是提高14.6%。)或者以不良率来报告(72%的良率=28%的不良率,82.8%的良率=17.2%的不良率,结果是不良率减少38.6%。)。
Hence, the same absolute results could translate into any of the following misleading or incomplete headlines:因此,同样结果可以得出以下任意一个误导或者是不完全的标题:
• A 14.6% increase in temperature (C) gave a 15% increase in yield. 温度(摄氏度)提高了14.6%,可以使良率提高15%。
• A 10% increase in temperature (F) gave a 38.6% reduction in defects. 温度(华氏度)提高10%,可以使不良率减少38.6%。
• A 14.6% increase in temperature (C) gave a 38.6% reduction in defects, in addition to the original option. 温度(摄氏度)提高14.6%,可以使不良率减少38.6%。
Clearly, the percentage changes are highly dependent on the summary chosen and give different impressions of the study’s results.很明显,总结方式的不同决定着百分比变化的不同,用不同的总结方式来表达同一研究结果也给大家带来不同的印象。 There are several other important errors in this headline. 同时,在这个标题中也存在着其他重要的错误。
First, the percentage increase of temperature is actually meaningless. 首先,温度增加的百分比是没有实际意义的。Percentages assume the zero on the scale corresponds to something absolute.百分比是假定从刻度0开始对应的绝对值。Here, 0°C or 0°F are relatively arbitrary and do not represent a starting point for the scale against which percentage changes can be sensibly measured.而这里的0摄氏度或者0华氏度是任意的,不代表温度刻度的起点,所以百分比变化差异这么大。
Perhaps even more misleading is the idea that a temperature change is in any way comparable to a change in yield.可能有甚至更多误导的想法,要将温度的变化以任何一种方式去跟良率的变化去做比较。 It might make sense to compare a change in input costs of production (how much does it cost to raise the temperature from 100°F to 110°F) against change in output yield, but the headline is a classic apples–to–oranges comparison that lacks intrinsic meaning.比较生产投入的成本增加(将温度从100华氏度提高到110华氏度需要增加多少成本。)与良率的变化可能会比较有意义一点,可是像上面的标题一样,就是典型的拿苹果和橙子做比较,实在是没有内在意义。
Complete and self contained完整全面
There is no substitute for providing complete information on the absolute scale—it allows the audience to directly assess the context and importance of the information.只有提供完整的信息,才能让读者直接评价上下文的关系以及信息的重要性。 Providing a graphical or numerical summary of recent history is also valuable for enhancing the context and incorporating a measure of natural variation.那么,图表化的或者是数字化的总结也是一种加强上下文联系和表现本身变异的方式。When the quantities of interest are obtained by estimation, the uncertainty associated with this should be included as well. 当通过估计而了解了感兴趣的问题时,相关的不确定的变异也包含在内。
While the catchy headlines and relative summaries have the opportunity to be attention–grabbers, statisticians and those who report data–based results should resist these tactics and provide a complete self–contained summary that includes all of the key information from which to make an informed decision. 虽然容易让人上当的标题和有关联的总结都有机会引起大家的注意,可是数据采集者,统计人员以及那些报告数据的人们,都应该能抵抗这些欺骗策略,从而根据数据结果提供一个全面完整的总结,其中包括所有的关键信息,以致可以做出一个周全的决定。
Christine M Anderson-Cook is a research scientist at Los Alamos National Laboratory in Los Alamos, NM. She earned a doctorate in statistics from the University of Waterloo in Ontario. Anderson-Cook is a fellow of the American Statistical Association and a senior member of ASQ.克里斯廷M安德森-库克是美国新墨西哥州洛斯阿拉莫斯洛杉矶国家实验室的研究员。她在美国衣安大略湖沃特卢大学获得统计学博士头衔。安德森-库克是美国统计协会的特别成员,同时也是美国质量协会的资深成员。
没有找到相关结果
已邀请:


3 个回复
小编H (威望:4) (广东 广州) 互联网 员工
赞同来自: