
第四十五篇 A five-pronged approach to analyze process data
本帖最后由 小编H 于 2011-11-22 11:22 编辑
你好,我是小编H。请对以下文章有校稿兴趣的组员留下你的预计完成时间,并发短信息联系小H,以便小编登记翻译者信息以及文章最终完成时的奖惩工作。感谢支持翻译组!
翻译:http://www.6sq.net/space-uid-393147.html 校稿:xy_persist
Make Data MatterA five-pronged approach to analyze process data解决数据问题——“五管齐下”分析过程数据
by Ronald D. S nee
作者:Ronald D. Snee
Is data analysis an art or a science?Arguments exist for both sides, and many people simply come down in the middle.In my mind, I believe it’s both.
数据分析是一门艺术或科学? 两种争论一直存在,很多人就简单的持中立态度。而在我看来,数据分析即是艺术也是科学。
Regardless of which view you take, thediscussion misses a critical element—the need for an explicitly articulatedstrategy for data analysis. In fact, the various attitudes toward the nature ofdata analysis of ten imply unreflective strategies.
无论你持有哪种观点,一个非常关键因素是不能少的,那就是数据分析需要有一个明确而且逻辑非常缜密的策略。事实上,很多数据分析方法都没有明确的策略。
Partisans of data analysis as an art simplymight look at the data, manipulate it based on their intuition and experience,and proceed confidently to extract what they believe is useful information. Themore scientific folks, with perhaps too much faith in numbers, go straight to statisticalsoftware and do some indisputable number crunching.
把数据分析作为艺术的人,他们在进行数据分析时候,是基于他们自己直觉和经验,并满怀信心地去提取他们认为是有用的信息。认为数据分析是科学的人,对数字本身非常信仰,直接用统计软件做一些纯数字运算。
Those who stand on middle ground—possiblythe great majority of practitioners—do a little of both: rely on their insightto manipulate the data, run the numbers, do some further manipulation and rerunthe numbers until they achieve what they believe is a satisfactory result.
持中间态度的人—实际工作中大部分人都这样—两样都做:依靠他们的洞察力,进行数据提取,然后做运算;然后对数据进一步的分析处理,并重新进行数字运算,直到他们获得他们认为的满意结果。
All of those approaches are likely toproduce questionable results in terms of what the analysis addresses and thesignificance of the results.
就分析的方法和意义而言,以上这些方法都可能产生可疑的结果。
Five activities Practitioners can avoid thepitfalls of these unreflective or ad hoc approaches by adopting a clearlyarticulated, proven strategy for analyzing process data and systematicallyfollowing that strategy.1Such a strategy entails five essential activities:
在实际工作的时候,我们可以采用逻辑非常清晰且已经被证明有效的策略来避免出现得出一些草率的分析结果。这种策略包括以下五个基本活动:
2。研究数据的谱系来源。
3。用图形表示分析过程。
4。用图形来展示数据。
5。用统计方法分析数据。
Note that these are iterative, as opposedto sequential, activities. Depending on the circumstances, the order of some ofthese activities may shift.
请注意,这些活动是迭代重复的循环的,而不是按照顺序一成不变的。根据实际的情况,也可以改变活动的顺序。
For example, in the mutually dependentiterations of this approach, the graphical representation of the process mayprecede the examination of the pedigree. In any case, most of these activitieslook forward and backward. The examination of the data’s pedigree—where it camefrom and how it was collected—may drive the analyst back to a fullerexploration of the context of the process to fill out that pedigree.
例如,在相互依存的迭代过程中这些解决问题方法的循环运用过程中,分析过程的图形展示可以先于研究数据的谱系来源。在任何情况下,这些活动都可以前移或者后移。检查数据的来源(数据的获取以及如何收集),可以促使分析人员进一步熟悉数据的谱系,对数据的范围有更全面的理解。
But the pedigree of the data also points tohow the process should be graphically represented. That, in turn, couldretrospectively suggest the need for additional types of data and prospectivelyaffect the graphical representation. By engaging iteratively in these activities,you can arrive at important results that are ready to be fully and persuasivelyreported.
但是数据的系谱来源也可以说明过程中应如何用图形表示。反过来,可以追溯是否需要其他的数据类型和预示图形所表达的影响趋势。通过这些反复的活动,可以得出全面和有说服力报告的重要结论。
This approach offers at least threedistinct advantages over less structured approaches. First, it is repeatable—itcan be used in any situation that calls for the greater understanding of aprocess. Second, like sound processes themselves, it’s robust—flexible enoughto encompass the wide variation of particulars to be found in differentsituations. Third, and most importantly, it’s more likely to produce usefulresults.
这种方法比结构化程度较低的方法至少有三个明显的优势:首先,它是可重复的,它可以在任何需要情况下更深入的了解的过程。其次,就像其本身健全的过程一样,可以灵活包括运用在不同情况下方方面面的细节。第三,也是最重要的的,它更可能产生得到有用的结果。
Understanding the context
了解背景范围
It’s difficult to know precisely how toproceed until you ask the most basic of questions: What is the purpose of theanalysis? Are you trying to confirm a hypothesis?
只有当你弄清楚两个对最基本的问题后,你才能清楚知道如何进行分析。这两个基本问题是:分析的目的是什么?你是否在试图证实一个假设?了解后,你才能清楚知道如何进行分析。
For example, a manufacturer that uses rawmaterials from two different vendors suspects that differences in quality arecausing defects in the finished product. Data analysis can confirm ordisconfirm the hypothesis and, in this example, identify the offending vendor.Such contexts call for what is sometimes referred to as confirmatory dataanalysis.
例如:一家工厂使用两个不同供应商提供的原材料,假设原材料的不同是导致产品最终缺陷的原因。通过数据分析可以证实或推翻假设说,比如这个例子,就可以确定那家是违规的供应商。这种情况称就是所说的确定的之为数据分析验证。
Alternatively, let’s say you’re trying tosolve specific problems, the causes of which you do not understand. Forexample, a chemical process is producing unacceptable variations in purity frombatch to batch. Or a business process, like a bank loan approval process, istaking far too long to complete. Or, perhaps a distributor’s percentage ofon-time deliveries is fluctuating widely. These contexts call for exploratorydata analysis, which must first have a hypothesis to test.
另外,比方说,你正在试图解决的某些不明原因导致的具体问题其中有你不明白的原因。例如,过程的不确定因素造成一个化学工艺生产的产品的纯度是不合格。或者一个业务流程,像银行贷款审批程序这样的业务流程,需要很长时间才能走完。或者分销商的准时交货率相差波动很大。这些背景情况下需要先进行假设验证才能完成进行探索性数据分析,必须首先有一个假设来测试。
In confirmatory and exploratory analyses ofa process, the goal is the same: find the inputs and the controlled anduncontrolled variables that have a major impact on the output of the process.2
在进行的确定性验证分析性和探索性的分析过程中,我们的目标是相同的:找到确定在对过程的输出结果有主要影响的可控或不可控的输入变量,这些变量是可控或者不可控的。
Examining the pedigree
检查系谱查找数据来源
Data analysis begins with a data table,which is either provided to or constructed by the analyst. In either case, youshould always question the data because data can be, among many other things:
数据分析开始于一张数据表,这或者是分析人员提供或者制作的。在这两种情况下,你应该始终对数据持有怀疑态度,因为数据中还可能包含其它内容:
• Incorrect: Some of the information is wrong—for example, whensomeone monitoring a process records the data incorrectly or a measurementdevice is faulty.
• Irrelevant: Some of it is the wrong information—for example,when data on the wrong variables are captured.
• Incomplete: Crucial information is missing—for example, whendata on an important variable are missing.
• Misleading/biased: Data points you in the wrong direction foranalysis—for example, when an important variable has been examined only over ashort time, thus making it appear to be a constant.
•数据不正确的:有些信息是错误的,例如,过程检测数据的错误记录或测量设备有误(包括设备故障或设备选用不当)当有人监控过程中记录的数据不正确或测量设备故障的。
•数据不相关的,有些是错误的信息,例如,记录了一个错误的变量数据
•数据不完整的:关键信息丢失,例如,当一个重要的变量数据缺失。
•误导/偏颇:数据可能把你指向错误的分析方向,例如当一个重要的变量仅仅进行了通过短期的测量,这样就会使得这个变量看起来像常数。恒定的(不变的)
An understanding of the context of the processcan guard against these errors, but the context alone is insufficient. Giventhese and the many other shortcomings that can undermine the value of the data,it is absolutely critical to understand the pedigree of the data—where it camefrom and how it was collected.
了解数据的过程背景可以防止这些错误,但仅仅了解过程背景是不够的。鉴于这些或者其他的不足,会破坏数据的价值,所以了解数据是从哪里来的,如何收集,弄清楚数据对理解数据的来源系谱就变得尤为重要。
For example, consider a batch manufacturingprocess in which a sample is taken every shift and carried to an analytical labwhere it is tested for purity, and the results are recorded. Thus, the datatrail is:
例如,在一个批量制造过程中,每个班次取样送到实验室进行纯度测量并记录,样品是从每个批次或者从用于纯度测试的实验室而来因此,数据的线索跟踪过程是这样的:
Production process ► sampling process ►testing process ► data-logging process.
生产(过程)►采样(的过程)►测试(过程)►数据记录(过程)。
To understand the resulting data, it isnecessary to understand this data trail and the production process parameters.That is the pedigree of the data.
要了解所产生的数据结果数据,就必须有必要了解这一数据的采集、跟踪过程产生轨迹和生产工艺参数,这就是数据的系谱来源。
Incomplete understanding of the data’s pedigreecan lead you down wrong analytical trails. Suppose, for example, apharmaceutical company is experiencing differences in yield from batch to batchof a product because of the properties of the raw materials supplied by avendor. Although the properties for each batch of raw materials are withinspecifications, the yield nevertheless varies unacceptably.
对数据来源了解不充分会让你采取错误的数据分析路径。比如说,假设一家制药厂的现在某种产品不同批次产品收率出现差异,原材料又是由同一家供应商提供的。虽然每批次的原料的特性都在规格范围内,但收率的对数据的系谱不了解会导致错误的分析试验。假设,例如,由于供应商提供的原材料属性问题,一家制药厂每批次的产量存在差异性。虽然产品的原材料属性都在规格范围内,但产量的差异仍不可接受。
The analyst has been given a data tablethat includes the properties of the raw materials for each batch of productunder consideration. But if the analyst does not know that some raw materialbatches were analyzed by the vendor’s quality assurance lab and some by themanufacturer, then there is a strong possibility the analysis will come upempty. By taking the time to understand the pedigree of the data fully, theanalyst can save much frustration and fruitless work.
分析师员得到一张包括每一批原材料属性的数据表 ,但是,如果分析师员不知道部分原材料是由供应商的质量保证实验室提供分析而和另外一部分是由制造商提供的话,分析员最后结果很有可能一无所获。所以花一些时间去全面的了解数据的系谱来源,可以减少分析时候的挫折感和做一些徒劳的工作。
Some Guiding Principles
指导性原则
• Theprocess provides the context for the problem being studied and the data beinganalyzed.
• Knowthe pedigree of the data—the who, what, when, where, why and how of itscollection.
• Analysis is defined by how the data were generated.
• Understand the measurement system as well as the process.
• Beaware of human intervention in a process. Humans are often a large source ofvariation.
•过程中提供的问题背景是正在研究或正在和进行数据分析的背景下。
•了解数据的系谱来源—是谁(采集的),是什么,何时采集,何地采集,为什么采集以及怎么样收集
•分析数据是如何产生的数据。
•了解测量系统以及过程。
•了解测量过程中的人为干预,人往往是(数据异常)波动的主要(原因)来源。
Graphing the process
用图表表示过程
A graphical representation of the processshows how the process works from end to end. Such representations fall into twobroad categories: flow charts and schematics. A flow chart maps the sequenceand flow of the process and often includes icons, such as pictures of a truckto represent a transportation step or smokestacks to indicate a factory.
通过图形表示过程可以展示过程是如何从一端运转到另一端。这种展示可以分为两大类:流程图和示意图。流程图按照顺序和流动过程形式展现,通常包括图标,如一辆卡车代表的是交通运输环节或烟囱表明是工厂。
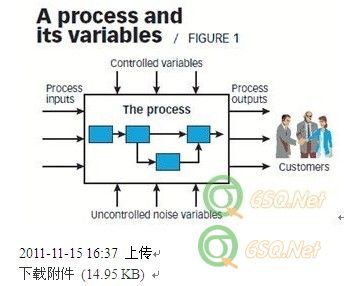
A schematic representation is designed toexhibit the inputs and the controlled and uncontrolled variables that go into aprocess to produce its outputs. Both types of representation reinforce oneanother by suggesting what types of data are needed, where they can be foundand how they can be analyzed.
示意图用于展示输入因素因子以及过程中的可控和不可控变量,最终得到的输出变量。两种类型的表现手法可以通过证明“彼此加强需要什么类型的数据,在那里他们可以找到,以及如何进行分析”来相互强化。
Figure 1 is an elementary schematicrepresentation of a process (such as pharmaceutical, chemical or loan approvalAs the analyst knows, the context is unacceptable variations in yield frombatch to batch of the finished product. Therefore, “yield” is the key output.
图1是一个基本的过程示意图(如制药,化工或贷款审批)。正如分析员所知,这一部分内容(不可控变量)在每一批完成产品的“产量收率”中表示的是不可接受差异。因此“产量收率”是关键输出。
To get an accurate picture of the processagain, however, analysts should not simply rely on the context. To find out howthe process really works, they should also observe the process first-hand andquestion the people who operate it. This investigation might also lead theanalyst to further refine the pedigree of the data—the who, when and why of itsmeasurement and collection. 然而,为了准确了解过程的画面的反映整个过程,分析人员不应该仅仅依靠上下文过程数据。分析人员应该直接赴一线去观察过程,询问具体的操作人员,这样才能知道流程是如何进行运转的。这样分析人员进一步了解数据的系谱来源,即是谁在什么时间收集的,以何时以及为什么要进行测量和数据收集。
With yield as the key output of amanufacturing process, the analyst can now graphically represent the processand fill in the blanks with the sources of possible variation that led to theunacceptable variations in yield. For the inputs, sources of variation might beenergy, raw materials and different lots of the same raw materials. Controlledvariables that go into the process might include things like temperature, speedof flow and mixing time.随着产量将收率作为的制造过程中的关键输出,分析人员可以用图形来方式表示过程并进行数据采集,也知道哪些是可能导致不可接受变量的来源。对于输入和变量,波动的来源可能是能源,原材料和不同批次的相同原料。与过程相关的可控变量包括如温度,流速和搅拌时间等。
In essence, controlled variables are thethings that can be adjusted with a knob or a dial. Uncontrolled variables thatgo into this process may include human intervention and differences in work teams,production lots, days of the week, machines or even heads on the same machine. Inthe output of the process, variation may result from the measurement system itself.实质上,可控变量是指能够用通过工具(knob or dial旋钮或刻度进行调节度量的变量事物。不可控变量在流程中可能包含人为干涉和不同的工作团队、生产批量、每周工作天数、生产工具生产设备甚至是同一个生产工具的使用人数所产生的差异同种设备的数量。在流程的输出变量中,波动可能由于度量测量体系本身所产生。
A good rule to follow when you have, forexample, two production lines doing the same thing or two pieces of equipmentperforming the same task, is to assume they vary until proven otherwise. That’sespecially true for the human factor. Experience shows that in creating theinitial data table and in the graphical representation of the process, thehuman element is a frequently overlooked source of variation. 可以遵循一个规则, 比方说,当你有两条生产线做同样的事情或者两套设备执行同样的任务,能够遵循的一个好的规则是确信他们是有差异的,直到你能证明他们是无差异的。你可以先假定不一样,直到证明它们确实没差别在人类的工厂里这毫无疑问是正确的。经验表明,在创建初始数据表和用图形表示的过程的时候,人为因素是一个经常被忽视的一种波动来源变量。
In the aforementioned pharmaceuticalmanufacturing process, the analyst may overlook that the process includes threeshifts with four different work teams on the shifts.在前面提到的药品生产过程中,分析人员可能忽略4个不同工作组的三个班次的交替进行三次转换的过程。
As a result of the observation andinvestigation that goes into constructing the graphical representation of theprocess, however, the analyst makes sure the data table records which teamproduced which batches on which days and that the data are stratified in theanalysis. The failure to take that human element into account results in ahighly misleading data table and might obscure the ultimate solution to theproblem.作为分析调查的结果制作流程图来展示工艺流程分析人员通过观测和深入调查研究了,分析人员要确保数据记录表要包含产品批次别,日别,班次别这些分层记录的数据知道数据是由哪个团队,是哪天以及哪个批次产生的,所以她们认为这些数据是分层。但是如果错误的把人的因素引入统计结果由于把人为因素考虑进去,从而导致错误数据表中数据的错误记录,可能会掩盖最终问题的解决办法。
Graphing the data
用图表表示数据
The graphical representation of theprocess—and the understanding of the possible sources of variation it helpsgenerate—suggests ways in which the analyst can graphically represent the data.Because data are almost always sequential, a run chart is often needed. In ourexample, the x-axis would register time and they-axis would register yield. 用图形展示过程能够给分析人员提供用图形展示数据的方法,过程图能够给出数据产生过程中可能发生波动的来源。因为数据大部分是按照时间收集的,一般需要做趋势图。在我们举的例子中,以及了解产生变量的可能来源,分析人员可以用图表表示数据。决大部分数据都是有时间顺序的,所以做趋势图就非常有必要。以我们公司趋势图为例x轴代表时间和Y轴代表产量。
A scatter plot also may be used, withprocess variables registered on the x-axis and process outputs registered onthe y-axis. Other familiar graphical techniques include box plots, histograms,dot plots and Pareto charts.散点图也是一种经常使用的图形,X轴表示过程变量,Y轴表示过程输出变量。其他的熟悉图形方法有箱线图,直方图,点图和帕累托图。
In using any of these techniques, the goalis to make sure you are exploring the relationships of potentially importantvariables and preparing an appropriate graphical representation for purposes ofstatistical analysis. Plotting the data in different ways can lead to insightsand surprises about the sources of variation. 不管使用哪一种图形表示,我们的目标是把重要的变量之间的潜在关系可以表现出来,并通过适当的图形来实现来展示统计分析的目的。通过不同图形来展示数据,会得到不同的图形,我们会惊喜的发现波动的来源视角。
Statistically analyzing the data
用统计的方法进行数据分析
The statistical analysis of the data,usually with the aid of statistical soft ware, establishes what factors arestatistically significant. For example, are the differences in yield producedby different work teams statistically significant? What about variations intemperature or flow? What about the measurement system itself? 用统计的方法进行数据分析通常需要在统计软件的帮助下,数据的统计分析需确定那些统计因子的具有显著的统计意义。例如,不同的工作组的产量是不同吗制造的产品收率差异具有统计意义吗?温度或流量是怎么变化的?测量系统本身的有什么问题?
The key to success lies in intimatelyknowing the data from the context of the process, graphically representing itand formulating a model that includes the comparisons, relationships, tests andfits you are going to study.对数据进行分析成功的关键在于要对数据产生的的背景非常熟悉,能够用图形展示过程用图形展示数据,并建立(一个)具有可比性、相关性、可测试验证、可拟合的模型这个模型可以用于进一步的研究进行进一步研究。
Once you have created the graphics and donethe statistical calculations, the results should be checked against the model.Does it account for all of the variation? In short, do the results make sense?If so, you can confidently report your results.3如果一旦你创建了的图形,并运行了统计分析,最后统计的结果要再一次验证你的数据模型。是否包含记述了所有的变量?总之,你的结果有意义吗?如果有意义,就可以放心地汇报你的结果。
Beyond analysis to action
将分析结果付诸行动
The final point about reporting the resultsoffers a reminder that analysis goes beyond the exploratory or confirmatory.The analyst also must be able to display and communicate results to decisionmakers. The most elegant analysis possible is wasted if it fails to communicateand the organization therefore fails to act. 最后给分析人员一个提醒:分析的结果不仅仅局限于探究性分析和验证。分析人员必须要能跟决策者沟通,并向决策者清楚地表达清楚你的分析结果,同时要会沟通。如果因为不擅长沟通或者而造成组织没有将分析结果付诸行动执行,那是非常可惜的再完美的分析也是徒劳无功。
Early in my career, I was asked to analyzewhether a chemical company’s new product had adversely affected animals insafety studies. Personnel in the company’s lab insisted the data from theexperiments showed adverse effects, and the company should therefore ceasedevelopment of the product. Analysts on the company’s business side hadconcluded the data showed no adverse effects. My analysis reached the sameconclusion, and in a showdown meeting between the business and the lab personnel,I presented my findings. 在我刚参加工作不久,参与分析了一家化工厂开发的新产成品是否对动物有不良影响的安全性研究。公司里实验部门的分析人员坚持认为实验数据显示得出的结果是对动物有不良影响,所以建议停止这家公司应该停止开发这款新产品。分析人员从公司的商业角度分析没有不良影响。我的分析得出同样地的结论,在实验部和商业部的最终表决会议上,我发表我的观点。
At the conclusion of my presentation,replete with analytical representations of the statistical significance of thedata, the lab director remained unconvinced. So I handed him one final graph: adot plot that, for some reason, I had not included in my presentation.我演讲陈述的结论都以具有显著统计特征的数据为依据,是数据分析的结果但实验部门的主管始终不为所动持怀疑态度。所以,我递给他展示了最后一张图表的最后一个图-点图,出于某种原因,我没有在我的演包括之前的陈述中包含这张图。
He looked at the graph and began to thinkaloud while everyone in the meeting sat silently. He continued to look and talkand look and talk. At last, he said emphatically, “Maybe there isn’t adifference.”他一边看着图一边自言自语的说些什么,其他的人安静的坐在一旁。他继续一边看一边说些什么自言自语,最后他大声的说了一句:“也许没有什么区别。”
In the absence of that persuasive graphicalrepresentation and model of the data, the company might have ceased productionof what turned out to be a valuable and harmless product. The bottom line isthat the analyst must not only do data analysis that matters, but also make itmatter. 在缺乏有说服力的图表和数据模型时候,公司可能会放弃生产原本是有价值却无害的产品。因此分析人员不仅要分析数据本身只针对问题进行数据分析,也要将使数据分析的结果变为成为事实。
你好,我是小编H。请对以下文章有校稿兴趣的组员留下你的预计完成时间,并发短信息联系小H,以便小编登记翻译者信息以及文章最终完成时的奖惩工作。感谢支持翻译组!
翻译:http://www.6sq.net/space-uid-393147.html 校稿:xy_persist
Make Data MatterA five-pronged approach to analyze process data解决数据问题——“五管齐下”分析过程数据
by Ronald D. S nee
作者:Ronald D. Snee
Is data analysis an art or a science?Arguments exist for both sides, and many people simply come down in the middle.In my mind, I believe it’s both.
数据分析是一门艺术或科学? 两种争论一直存在,很多人就简单的持中立态度。而在我看来,数据分析即是艺术也是科学。
Regardless of which view you take, thediscussion misses a critical element—the need for an explicitly articulatedstrategy for data analysis. In fact, the various attitudes toward the nature ofdata analysis of ten imply unreflective strategies.
无论你持有哪种观点,一个非常关键因素是不能少的,那就是数据分析需要有一个明确而且逻辑非常缜密的策略。事实上,很多数据分析方法都没有明确的策略。
Partisans of data analysis as an art simplymight look at the data, manipulate it based on their intuition and experience,and proceed confidently to extract what they believe is useful information. Themore scientific folks, with perhaps too much faith in numbers, go straight to statisticalsoftware and do some indisputable number crunching.
把数据分析作为艺术的人,他们在进行数据分析时候,是基于他们自己直觉和经验,并满怀信心地去提取他们认为是有用的信息。认为数据分析是科学的人,对数字本身非常信仰,直接用统计软件做一些纯数字运算。
Those who stand on middle ground—possiblythe great majority of practitioners—do a little of both: rely on their insightto manipulate the data, run the numbers, do some further manipulation and rerunthe numbers until they achieve what they believe is a satisfactory result.
持中间态度的人—实际工作中大部分人都这样—两样都做:依靠他们的洞察力,进行数据提取,然后做运算;然后对数据进一步的分析处理,并重新进行数字运算,直到他们获得他们认为的满意结果。
All of those approaches are likely toproduce questionable results in terms of what the analysis addresses and thesignificance of the results.
就分析的方法和意义而言,以上这些方法都可能产生可疑的结果。
Five activities Practitioners can avoid thepitfalls of these unreflective or ad hoc approaches by adopting a clearlyarticulated, proven strategy for analyzing process data and systematicallyfollowing that strategy.1Such a strategy entails five essential activities:
在实际工作的时候,我们可以采用逻辑非常清晰且已经被证明有效的策略来避免出现得出一些草率的分析结果。这种策略包括以下五个基本活动:
- Understanding the context of the analysis.
- Examining the pedigree of the data.
- Graphically representing the process.
- Graphically representing the data.
- Statistically analyzing the data.
2。研究数据的谱系来源。
3。用图形表示分析过程。
4。用图形来展示数据。
5。用统计方法分析数据。
Note that these are iterative, as opposedto sequential, activities. Depending on the circumstances, the order of some ofthese activities may shift.
请注意,这些活动是迭代重复的循环的,而不是按照顺序一成不变的。根据实际的情况,也可以改变活动的顺序。
For example, in the mutually dependentiterations of this approach, the graphical representation of the process mayprecede the examination of the pedigree. In any case, most of these activitieslook forward and backward. The examination of the data’s pedigree—where it camefrom and how it was collected—may drive the analyst back to a fullerexploration of the context of the process to fill out that pedigree.
例如,在相互依存的迭代过程中这些解决问题方法的循环运用过程中,分析过程的图形展示可以先于研究数据的谱系来源。在任何情况下,这些活动都可以前移或者后移。检查数据的来源(数据的获取以及如何收集),可以促使分析人员进一步熟悉数据的谱系,对数据的范围有更全面的理解。
But the pedigree of the data also points tohow the process should be graphically represented. That, in turn, couldretrospectively suggest the need for additional types of data and prospectivelyaffect the graphical representation. By engaging iteratively in these activities,you can arrive at important results that are ready to be fully and persuasivelyreported.
但是数据的系谱来源也可以说明过程中应如何用图形表示。反过来,可以追溯是否需要其他的数据类型和预示图形所表达的影响趋势。通过这些反复的活动,可以得出全面和有说服力报告的重要结论。
This approach offers at least threedistinct advantages over less structured approaches. First, it is repeatable—itcan be used in any situation that calls for the greater understanding of aprocess. Second, like sound processes themselves, it’s robust—flexible enoughto encompass the wide variation of particulars to be found in differentsituations. Third, and most importantly, it’s more likely to produce usefulresults.
这种方法比结构化程度较低的方法至少有三个明显的优势:首先,它是可重复的,它可以在任何需要情况下更深入的了解的过程。其次,就像其本身健全的过程一样,可以灵活包括运用在不同情况下方方面面的细节。第三,也是最重要的的,它更可能产生得到有用的结果。
Understanding the context
了解背景范围
It’s difficult to know precisely how toproceed until you ask the most basic of questions: What is the purpose of theanalysis? Are you trying to confirm a hypothesis?
只有当你弄清楚两个对最基本的问题后,你才能清楚知道如何进行分析。这两个基本问题是:分析的目的是什么?你是否在试图证实一个假设?了解后,你才能清楚知道如何进行分析。
For example, a manufacturer that uses rawmaterials from two different vendors suspects that differences in quality arecausing defects in the finished product. Data analysis can confirm ordisconfirm the hypothesis and, in this example, identify the offending vendor.Such contexts call for what is sometimes referred to as confirmatory dataanalysis.
例如:一家工厂使用两个不同供应商提供的原材料,假设原材料的不同是导致产品最终缺陷的原因。通过数据分析可以证实或推翻假设说,比如这个例子,就可以确定那家是违规的供应商。这种情况称就是所说的确定的之为数据分析验证。
Alternatively, let’s say you’re trying tosolve specific problems, the causes of which you do not understand. Forexample, a chemical process is producing unacceptable variations in purity frombatch to batch. Or a business process, like a bank loan approval process, istaking far too long to complete. Or, perhaps a distributor’s percentage ofon-time deliveries is fluctuating widely. These contexts call for exploratorydata analysis, which must first have a hypothesis to test.
另外,比方说,你正在试图解决的某些不明原因导致的具体问题其中有你不明白的原因。例如,过程的不确定因素造成一个化学工艺生产的产品的纯度是不合格。或者一个业务流程,像银行贷款审批程序这样的业务流程,需要很长时间才能走完。或者分销商的准时交货率相差波动很大。这些背景情况下需要先进行假设验证才能完成进行探索性数据分析,必须首先有一个假设来测试。
In confirmatory and exploratory analyses ofa process, the goal is the same: find the inputs and the controlled anduncontrolled variables that have a major impact on the output of the process.2
在进行的确定性验证分析性和探索性的分析过程中,我们的目标是相同的:找到确定在对过程的输出结果有主要影响的可控或不可控的输入变量,这些变量是可控或者不可控的。
Examining the pedigree
检查系谱查找数据来源
Data analysis begins with a data table,which is either provided to or constructed by the analyst. In either case, youshould always question the data because data can be, among many other things:
数据分析开始于一张数据表,这或者是分析人员提供或者制作的。在这两种情况下,你应该始终对数据持有怀疑态度,因为数据中还可能包含其它内容:
• Incorrect: Some of the information is wrong—for example, whensomeone monitoring a process records the data incorrectly or a measurementdevice is faulty.
• Irrelevant: Some of it is the wrong information—for example,when data on the wrong variables are captured.
• Incomplete: Crucial information is missing—for example, whendata on an important variable are missing.
• Misleading/biased: Data points you in the wrong direction foranalysis—for example, when an important variable has been examined only over ashort time, thus making it appear to be a constant.
•数据不正确的:有些信息是错误的,例如,过程检测数据的错误记录或测量设备有误(包括设备故障或设备选用不当)当有人监控过程中记录的数据不正确或测量设备故障的。
•数据不相关的,有些是错误的信息,例如,记录了一个错误的变量数据
•数据不完整的:关键信息丢失,例如,当一个重要的变量数据缺失。
•误导/偏颇:数据可能把你指向错误的分析方向,例如当一个重要的变量仅仅进行了通过短期的测量,这样就会使得这个变量看起来像常数。恒定的(不变的)
An understanding of the context of the processcan guard against these errors, but the context alone is insufficient. Giventhese and the many other shortcomings that can undermine the value of the data,it is absolutely critical to understand the pedigree of the data—where it camefrom and how it was collected.
了解数据的过程背景可以防止这些错误,但仅仅了解过程背景是不够的。鉴于这些或者其他的不足,会破坏数据的价值,所以了解数据是从哪里来的,如何收集,弄清楚数据对理解数据的来源系谱就变得尤为重要。
For example, consider a batch manufacturingprocess in which a sample is taken every shift and carried to an analytical labwhere it is tested for purity, and the results are recorded. Thus, the datatrail is:
例如,在一个批量制造过程中,每个班次取样送到实验室进行纯度测量并记录,样品是从每个批次或者从用于纯度测试的实验室而来因此,数据的线索跟踪过程是这样的:
Production process ► sampling process ►testing process ► data-logging process.
生产(过程)►采样(的过程)►测试(过程)►数据记录(过程)。
To understand the resulting data, it isnecessary to understand this data trail and the production process parameters.That is the pedigree of the data.
要了解所产生的数据结果数据,就必须有必要了解这一数据的采集、跟踪过程产生轨迹和生产工艺参数,这就是数据的系谱来源。
Incomplete understanding of the data’s pedigreecan lead you down wrong analytical trails. Suppose, for example, apharmaceutical company is experiencing differences in yield from batch to batchof a product because of the properties of the raw materials supplied by avendor. Although the properties for each batch of raw materials are withinspecifications, the yield nevertheless varies unacceptably.
对数据来源了解不充分会让你采取错误的数据分析路径。比如说,假设一家制药厂的现在某种产品不同批次产品收率出现差异,原材料又是由同一家供应商提供的。虽然每批次的原料的特性都在规格范围内,但收率的对数据的系谱不了解会导致错误的分析试验。假设,例如,由于供应商提供的原材料属性问题,一家制药厂每批次的产量存在差异性。虽然产品的原材料属性都在规格范围内,但产量的差异仍不可接受。
The analyst has been given a data tablethat includes the properties of the raw materials for each batch of productunder consideration. But if the analyst does not know that some raw materialbatches were analyzed by the vendor’s quality assurance lab and some by themanufacturer, then there is a strong possibility the analysis will come upempty. By taking the time to understand the pedigree of the data fully, theanalyst can save much frustration and fruitless work.
分析师员得到一张包括每一批原材料属性的数据表 ,但是,如果分析师员不知道部分原材料是由供应商的质量保证实验室提供分析而和另外一部分是由制造商提供的话,分析员最后结果很有可能一无所获。所以花一些时间去全面的了解数据的系谱来源,可以减少分析时候的挫折感和做一些徒劳的工作。
Some Guiding Principles
指导性原则
• Theprocess provides the context for the problem being studied and the data beinganalyzed.
• Knowthe pedigree of the data—the who, what, when, where, why and how of itscollection.
• Analysis is defined by how the data were generated.
• Understand the measurement system as well as the process.
• Beaware of human intervention in a process. Humans are often a large source ofvariation.
•过程中提供的问题背景是正在研究或正在和进行数据分析的背景下。
•了解数据的系谱来源—是谁(采集的),是什么,何时采集,何地采集,为什么采集以及怎么样收集
•分析数据是如何产生的数据。
•了解测量系统以及过程。
•了解测量过程中的人为干预,人往往是(数据异常)波动的主要(原因)来源。
Graphing the process
用图表表示过程
A graphical representation of the processshows how the process works from end to end. Such representations fall into twobroad categories: flow charts and schematics. A flow chart maps the sequenceand flow of the process and often includes icons, such as pictures of a truckto represent a transportation step or smokestacks to indicate a factory.
通过图形表示过程可以展示过程是如何从一端运转到另一端。这种展示可以分为两大类:流程图和示意图。流程图按照顺序和流动过程形式展现,通常包括图标,如一辆卡车代表的是交通运输环节或烟囱表明是工厂。
A schematic representation is designed toexhibit the inputs and the controlled and uncontrolled variables that go into aprocess to produce its outputs. Both types of representation reinforce oneanother by suggesting what types of data are needed, where they can be foundand how they can be analyzed.
示意图用于展示输入因素因子以及过程中的可控和不可控变量,最终得到的输出变量。两种类型的表现手法可以通过证明“彼此加强需要什么类型的数据,在那里他们可以找到,以及如何进行分析”来相互强化。
Figure 1 is an elementary schematicrepresentation of a process (such as pharmaceutical, chemical or loan approvalAs the analyst knows, the context is unacceptable variations in yield frombatch to batch of the finished product. Therefore, “yield” is the key output.
图1是一个基本的过程示意图(如制药,化工或贷款审批)。正如分析员所知,这一部分内容(不可控变量)在每一批完成产品的“产量收率”中表示的是不可接受差异。因此“产量收率”是关键输出。
To get an accurate picture of the processagain, however, analysts should not simply rely on the context. To find out howthe process really works, they should also observe the process first-hand andquestion the people who operate it. This investigation might also lead theanalyst to further refine the pedigree of the data—the who, when and why of itsmeasurement and collection. 然而,为了准确了解过程的画面的反映整个过程,分析人员不应该仅仅依靠上下文过程数据。分析人员应该直接赴一线去观察过程,询问具体的操作人员,这样才能知道流程是如何进行运转的。这样分析人员进一步了解数据的系谱来源,即是谁在什么时间收集的,以何时以及为什么要进行测量和数据收集。
With yield as the key output of amanufacturing process, the analyst can now graphically represent the processand fill in the blanks with the sources of possible variation that led to theunacceptable variations in yield. For the inputs, sources of variation might beenergy, raw materials and different lots of the same raw materials. Controlledvariables that go into the process might include things like temperature, speedof flow and mixing time.随着产量将收率作为的制造过程中的关键输出,分析人员可以用图形来方式表示过程并进行数据采集,也知道哪些是可能导致不可接受变量的来源。对于输入和变量,波动的来源可能是能源,原材料和不同批次的相同原料。与过程相关的可控变量包括如温度,流速和搅拌时间等。
In essence, controlled variables are thethings that can be adjusted with a knob or a dial. Uncontrolled variables thatgo into this process may include human intervention and differences in work teams,production lots, days of the week, machines or even heads on the same machine. Inthe output of the process, variation may result from the measurement system itself.实质上,可控变量是指能够用通过工具(knob or dial旋钮或刻度进行调节度量的变量事物。不可控变量在流程中可能包含人为干涉和不同的工作团队、生产批量、每周工作天数、生产工具生产设备甚至是同一个生产工具的使用人数所产生的差异同种设备的数量。在流程的输出变量中,波动可能由于度量测量体系本身所产生。
A good rule to follow when you have, forexample, two production lines doing the same thing or two pieces of equipmentperforming the same task, is to assume they vary until proven otherwise. That’sespecially true for the human factor. Experience shows that in creating theinitial data table and in the graphical representation of the process, thehuman element is a frequently overlooked source of variation. 可以遵循一个规则, 比方说,当你有两条生产线做同样的事情或者两套设备执行同样的任务,能够遵循的一个好的规则是确信他们是有差异的,直到你能证明他们是无差异的。你可以先假定不一样,直到证明它们确实没差别在人类的工厂里这毫无疑问是正确的。经验表明,在创建初始数据表和用图形表示的过程的时候,人为因素是一个经常被忽视的一种波动来源变量。
In the aforementioned pharmaceuticalmanufacturing process, the analyst may overlook that the process includes threeshifts with four different work teams on the shifts.在前面提到的药品生产过程中,分析人员可能忽略4个不同工作组的三个班次的交替进行三次转换的过程。
As a result of the observation andinvestigation that goes into constructing the graphical representation of theprocess, however, the analyst makes sure the data table records which teamproduced which batches on which days and that the data are stratified in theanalysis. The failure to take that human element into account results in ahighly misleading data table and might obscure the ultimate solution to theproblem.作为分析调查的结果制作流程图来展示工艺流程分析人员通过观测和深入调查研究了,分析人员要确保数据记录表要包含产品批次别,日别,班次别这些分层记录的数据知道数据是由哪个团队,是哪天以及哪个批次产生的,所以她们认为这些数据是分层。但是如果错误的把人的因素引入统计结果由于把人为因素考虑进去,从而导致错误数据表中数据的错误记录,可能会掩盖最终问题的解决办法。
Graphing the data
用图表表示数据
The graphical representation of theprocess—and the understanding of the possible sources of variation it helpsgenerate—suggests ways in which the analyst can graphically represent the data.Because data are almost always sequential, a run chart is often needed. In ourexample, the x-axis would register time and they-axis would register yield. 用图形展示过程能够给分析人员提供用图形展示数据的方法,过程图能够给出数据产生过程中可能发生波动的来源。因为数据大部分是按照时间收集的,一般需要做趋势图。在我们举的例子中,以及了解产生变量的可能来源,分析人员可以用图表表示数据。决大部分数据都是有时间顺序的,所以做趋势图就非常有必要。以我们公司趋势图为例x轴代表时间和Y轴代表产量。
A scatter plot also may be used, withprocess variables registered on the x-axis and process outputs registered onthe y-axis. Other familiar graphical techniques include box plots, histograms,dot plots and Pareto charts.散点图也是一种经常使用的图形,X轴表示过程变量,Y轴表示过程输出变量。其他的熟悉图形方法有箱线图,直方图,点图和帕累托图。
In using any of these techniques, the goalis to make sure you are exploring the relationships of potentially importantvariables and preparing an appropriate graphical representation for purposes ofstatistical analysis. Plotting the data in different ways can lead to insightsand surprises about the sources of variation. 不管使用哪一种图形表示,我们的目标是把重要的变量之间的潜在关系可以表现出来,并通过适当的图形来实现来展示统计分析的目的。通过不同图形来展示数据,会得到不同的图形,我们会惊喜的发现波动的来源视角。
Statistically analyzing the data
用统计的方法进行数据分析
The statistical analysis of the data,usually with the aid of statistical soft ware, establishes what factors arestatistically significant. For example, are the differences in yield producedby different work teams statistically significant? What about variations intemperature or flow? What about the measurement system itself? 用统计的方法进行数据分析通常需要在统计软件的帮助下,数据的统计分析需确定那些统计因子的具有显著的统计意义。例如,不同的工作组的产量是不同吗制造的产品收率差异具有统计意义吗?温度或流量是怎么变化的?测量系统本身的有什么问题?
The key to success lies in intimatelyknowing the data from the context of the process, graphically representing itand formulating a model that includes the comparisons, relationships, tests andfits you are going to study.对数据进行分析成功的关键在于要对数据产生的的背景非常熟悉,能够用图形展示过程用图形展示数据,并建立(一个)具有可比性、相关性、可测试验证、可拟合的模型这个模型可以用于进一步的研究进行进一步研究。
Once you have created the graphics and donethe statistical calculations, the results should be checked against the model.Does it account for all of the variation? In short, do the results make sense?If so, you can confidently report your results.3如果一旦你创建了的图形,并运行了统计分析,最后统计的结果要再一次验证你的数据模型。是否包含记述了所有的变量?总之,你的结果有意义吗?如果有意义,就可以放心地汇报你的结果。
Beyond analysis to action
将分析结果付诸行动
The final point about reporting the resultsoffers a reminder that analysis goes beyond the exploratory or confirmatory.The analyst also must be able to display and communicate results to decisionmakers. The most elegant analysis possible is wasted if it fails to communicateand the organization therefore fails to act. 最后给分析人员一个提醒:分析的结果不仅仅局限于探究性分析和验证。分析人员必须要能跟决策者沟通,并向决策者清楚地表达清楚你的分析结果,同时要会沟通。如果因为不擅长沟通或者而造成组织没有将分析结果付诸行动执行,那是非常可惜的再完美的分析也是徒劳无功。
Early in my career, I was asked to analyzewhether a chemical company’s new product had adversely affected animals insafety studies. Personnel in the company’s lab insisted the data from theexperiments showed adverse effects, and the company should therefore ceasedevelopment of the product. Analysts on the company’s business side hadconcluded the data showed no adverse effects. My analysis reached the sameconclusion, and in a showdown meeting between the business and the lab personnel,I presented my findings. 在我刚参加工作不久,参与分析了一家化工厂开发的新产成品是否对动物有不良影响的安全性研究。公司里实验部门的分析人员坚持认为实验数据显示得出的结果是对动物有不良影响,所以建议停止这家公司应该停止开发这款新产品。分析人员从公司的商业角度分析没有不良影响。我的分析得出同样地的结论,在实验部和商业部的最终表决会议上,我发表我的观点。
At the conclusion of my presentation,replete with analytical representations of the statistical significance of thedata, the lab director remained unconvinced. So I handed him one final graph: adot plot that, for some reason, I had not included in my presentation.我演讲陈述的结论都以具有显著统计特征的数据为依据,是数据分析的结果但实验部门的主管始终不为所动持怀疑态度。所以,我递给他展示了最后一张图表的最后一个图-点图,出于某种原因,我没有在我的演包括之前的陈述中包含这张图。
He looked at the graph and began to thinkaloud while everyone in the meeting sat silently. He continued to look and talkand look and talk. At last, he said emphatically, “Maybe there isn’t adifference.”他一边看着图一边自言自语的说些什么,其他的人安静的坐在一旁。他继续一边看一边说些什么自言自语,最后他大声的说了一句:“也许没有什么区别。”
In the absence of that persuasive graphicalrepresentation and model of the data, the company might have ceased productionof what turned out to be a valuable and harmless product. The bottom line isthat the analyst must not only do data analysis that matters, but also make itmatter. 在缺乏有说服力的图表和数据模型时候,公司可能会放弃生产原本是有价值却无害的产品。因此分析人员不仅要分析数据本身只针对问题进行数据分析,也要将使数据分析的结果变为成为事实。
没有找到相关结果
已邀请:


3 个回复
xy_persist (威望:2) (天津 河西区) 电子制造 部长 - 6Sigma黑带
赞同来自:
这段时间以来,做做翻译和校稿,收获还是满大的~